I'm a huge fan of Ben Felix and his proposed factor tilts. Here we'll look at how to construct a U.S. version of his proposed model portfolio with factor tilts, ETFs to use, and why you might want to invest in it.
Interested in more Lazy Portfolios? See the full list here.
Disclosure: Some of the links on this page are referral links. At no additional cost to you, if you choose to make a purchase or sign up for a service after clicking through those links, I may receive a small commission. This allows me to continue producing high-quality content on this site and pays for the occasional cup of coffee. I have first-hand experience with every product or service I recommend, and I recommend them because I genuinely believe they are useful, not because of the commission I may get. Read more here.
Contents
Video
Prefer video? Watch it here:

Who Is Ben Felix?
Ben Felix is a portfolio manager at PWL Capital in Canada. He is perhaps better known for his YouTube channel Common Sense Investing and his Rational Reminder podcast alongside Cameron Passmore. Admittedly, he's been a major influence for my content.
Felix is a proponent of objectively looking at the evidence and data to inform and optimize investing decisions. For example, he is a proponent of index investing and small cap value, just like famous investors like Larry Swedroe and Paul Merriman.
Ben Felix's credentials include:
- Northeastern University – BSc, Mechanical Engineering
- Carleton University – MBA, Finance
- CFA Charterholder
- CFP Professional
- Chartered Investment Manager (CIM®)
What Is the Ben Felix Model Portfolio?
The Ben Felix Model Portfolio, as the name suggests, is a lazy portfolio designed by Ben Felix and Cameron Passmore of PWL Capital that utilizes globally diversified index funds plus factor tilts, particularly for Size, Value, and Profitability. You can find the paper here for the proposed factor portfolio. They discuss the merits of this portfolio across many episodes of their Rational Reminder podcast.
Felix maintains that there is a tradeoff between simplicity and optimization in index investing, and that we can look at the robust data supporting the Fama-French 5 Factor Model to slightly boost expected returns by diversifying across not only geographies but also risk factors outside of just market beta, providing globally diversified index exposure with small tweaks to increase factor exposure.
That said, note that simplicity is – and should be – absolutely reasonable and desirable for some or even most investors. Like I always say, you should aim to know exactly what you're buying and why you're buying it. Don't blindly copy this portfolio – or any portfolio – just because you heard it mentioned online. If you don't care to learn about equity risk factors, for example, or if a portfolio like this one is going to make you more likely to constantly tinker or have dissonance about potential underperformance, a one-fund solution using something like VT or a target date fund may be better suited for you, and that's perfectly fine. Felix himself notes that factor investing and tilts like these are likely only appropriate for the “die hard” investor and that novices should probably just stick to broad index funds to avoid tracking error regret.
If you do care to learn about factors, maybe check out this page first where I do a deep dive on them and then come back here to check out the portfolio. I've provided a brief surface-level summary of factors below.
Asset Pricing Models
The Capital Asset Pricing Model, or CAPM, revolutionary in its time in the 1960s, proposed market beta as the original risk factor to compare portfolios. Unfortunately, market beta only explains about 2/3 of the differences in returns between diversified portfolios.
Further advances led Fama and French to expand the model to 3 factors in the early 1990s, adding Size and Value. Over sufficiently long investing horizons, small stocks tend to outperform large stocks, and Value stocks tend to outperform Growth stocks. These 3 independent risk factors now had an explanatory power of 90% of the differences between portfolios.
The later additions of Profitability and Investment offered weak but reliable statistical evidence for the explanation of most of the final 10% of anomalies not explained by the 3 Factor Model. This newest model has since been called the Fama French 5 Factor Model.
Risk Factor Premia
The inherent statistical reliability of factors means they have been persistent and pervasive across markets. The factors with some of the most compelling evidence to enhance returns are still the original two additions of Size and Value. Specifically, the Size premium refers to the returns of small stocks minus the returns of large stocks, known as small minus big or SmB. Similarly, the Value factor is high book value stocks minus low book value stocks, written as high minus low or HmL.
The positive premiums delivered by these factors have been significant historically. Remember though that there have been extended rolling periods where factors delivered a negative premium from time to time. For example, the Value premium has suffered for about the last couple decades. We'll see this more in a second with a performance backtest using live fund data.
But there have also been periods of market underperformance where factors had a positive premium. Felix notes: “In fact, the market has historically been less reliable at delivering positive returns than small cap and value stocks.” This is illustrated above.
I don't employ or advise market timing, but AQR maintains that Value is still basically the cheapest it's ever been right now relative to history, suggesting that now may actually be the worst time to give up on the factor, and that it's due for a comeback. Value stocks beat Growth stocks in 2021 and 2022, so that comeback may indeed be happening.
Interestingly, the Size premium does not seem to apply to small cap growth stocks. Removing them from the data set improves the historical returns of the Size premium significantly. Thus, it's probably a good idea to only focus on small cap value.
Arguably more importantly, the other factors like Profitability and Investment exert greater premiums and have been more statistically robust within the small-cap universe. That is, all things being equal, essentially factors are more “powerful” in small cap stocks than in large cap stocks.
My own personal portfolio tilts toward these factors and closely resembles the portfolio below.
“Factor” ETFs?
Felix notes that newer financial products with “Factor” in the name ironically tend to deliver poor factor exposure and carry higher fees.
There are low-cost ETF products that have existed for many years which are better positioned to deliver on factor premiums than most so-called factor funds. A fund that is called a factor fund seems to automatically command a higher fee despite not being positioned to deliver on factor returns.”
As such, the model portfolio here is conveniently constructed with popular, low-fee ETFs. We also get some convenient exposure to Profitability via the U.S. small cap value ETFs noted below.
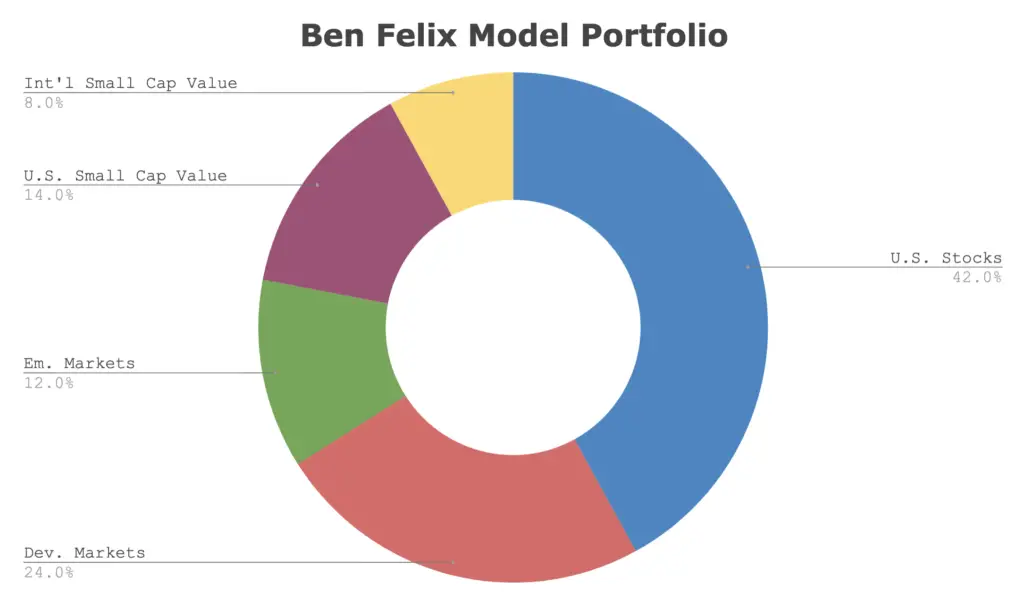
The Ben Felix Model Portfolio Asset Allocation
Since Ben Felix and PWL Capital are in Canada, the proposed model portfolio is based largely around Canadian index funds:
30% iShares Core S&P/TSX Capped Composite ETF – XIC
30% Vanguard US Total Market ETF – VUN
10% Avantis U.S. Small Cap Value ETF – AVUV
16% iShares Core MSCI EAFE IMI Index ETF – XEF
6% Avantis International Small Cap Value ETF – AVDV
8% iShares Core MSCI Emerging Markets IMI Index ETF – XEC
A U.S. translation looks like this:
42% U.S. Stock Market
24% International (ex-US) Developed Markets
12% Emerging Markets
14% U.S. Small Cap Value
8% International (ex-US) Small Cap Value
Note that this is a 100/0 (100% stocks, 0% bonds) version of this portfolio. If you want some bonds, simply scale back each stocks holding appropriately. For example, an 80/20 allocation would look like this:
34% U.S. Stock Market
19% International (ex-US) Developed Markets
10% Emerging Markets
11% U.S. Small Cap Value
6% International (ex-US) Small Cap Value
20% Bonds
Ben Felix Model Portfolio Performance vs. the S&P 500
Using live fund data with comparable mutual funds from Dimensional, here's a rough approximation of how the Ben Felix Model Portfolio compared to the S&P 500 index from 2000 through 2022: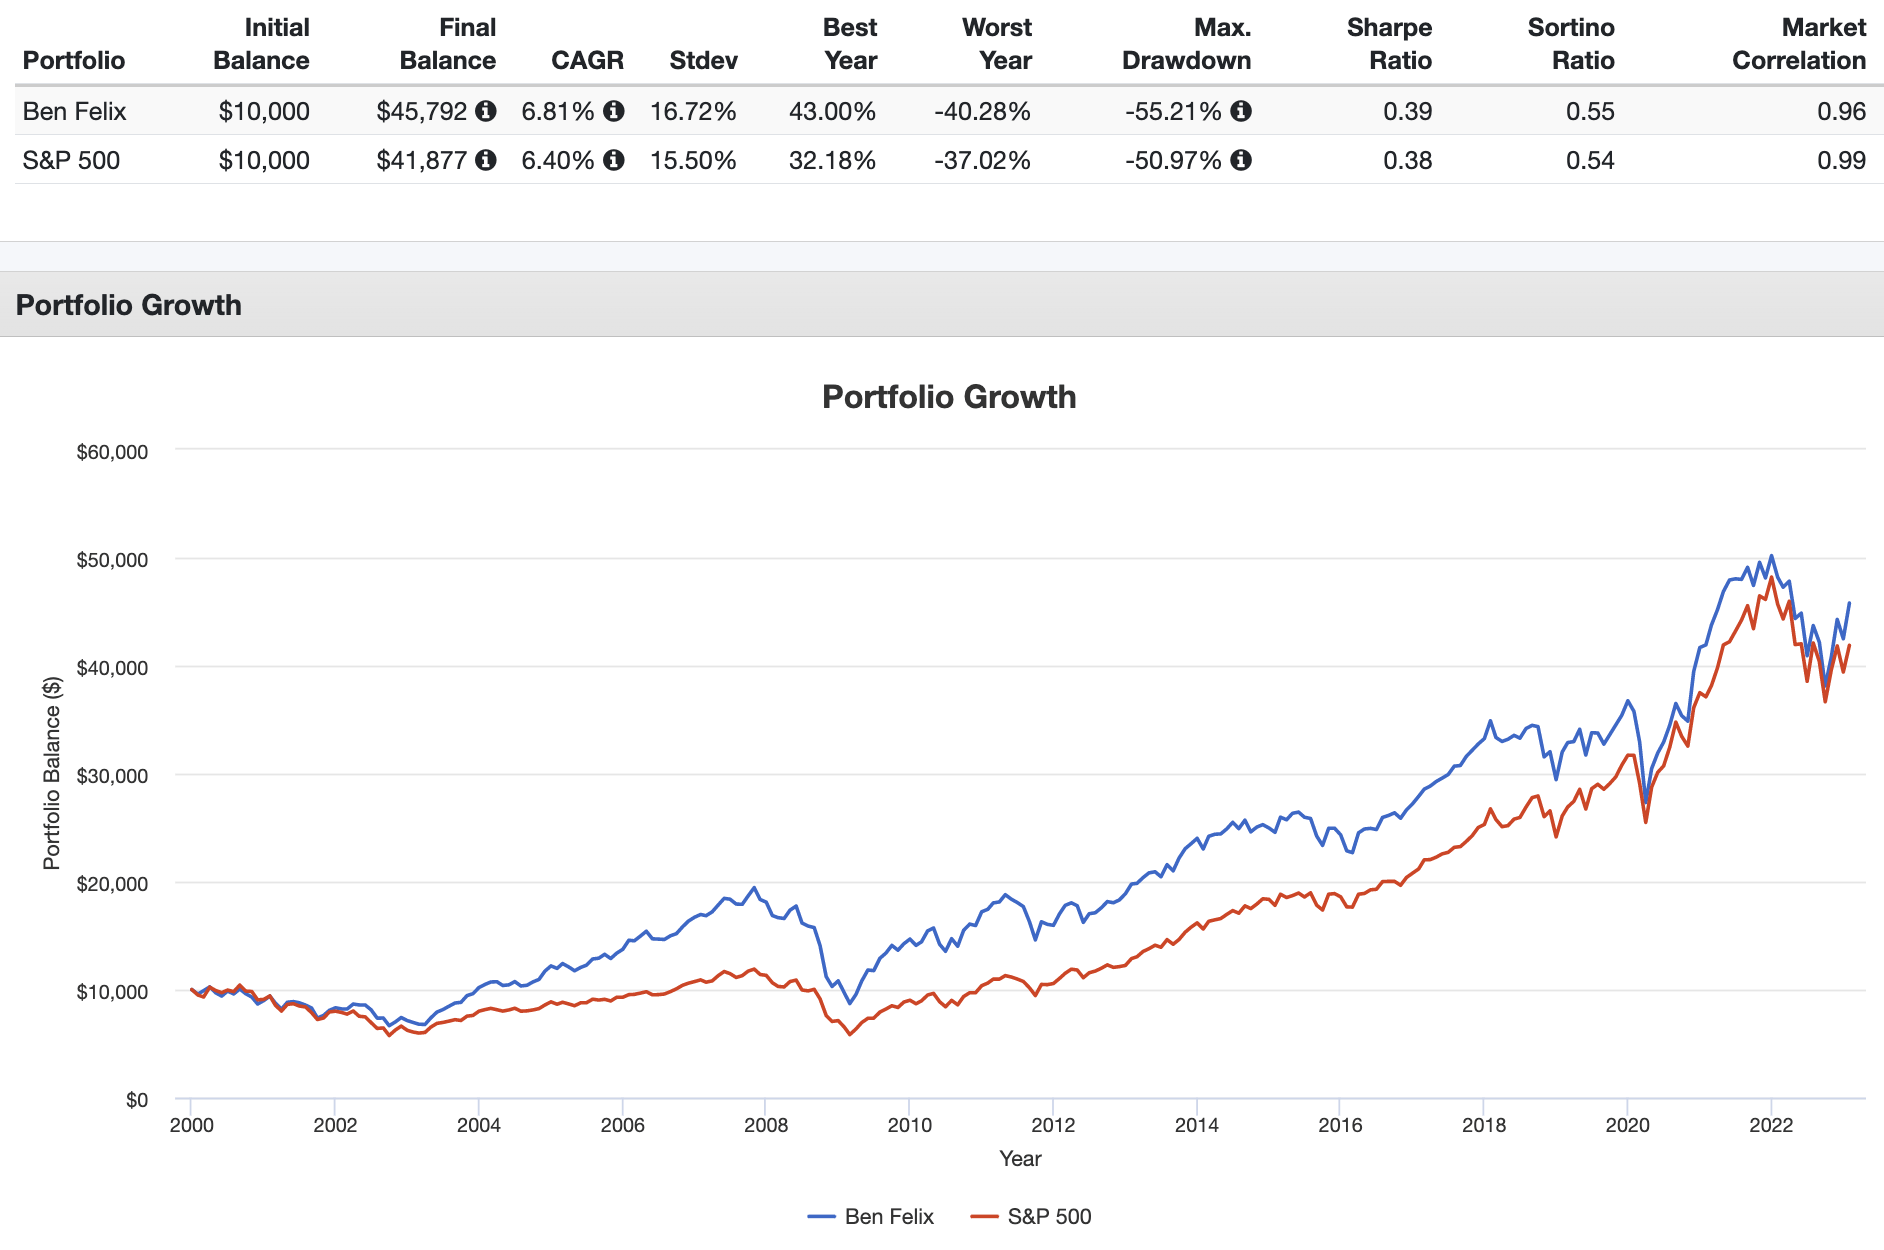
It has come out ahead on both a general and risk-adjusted basis, albeit with slightly greater volatility and a slightly larger max drawdown.
Looking at the 3-year rolling returns, as we would expect, we can see that the Size and Value factor premia did great in the early 2000's and suffered in the latter years of the backtest: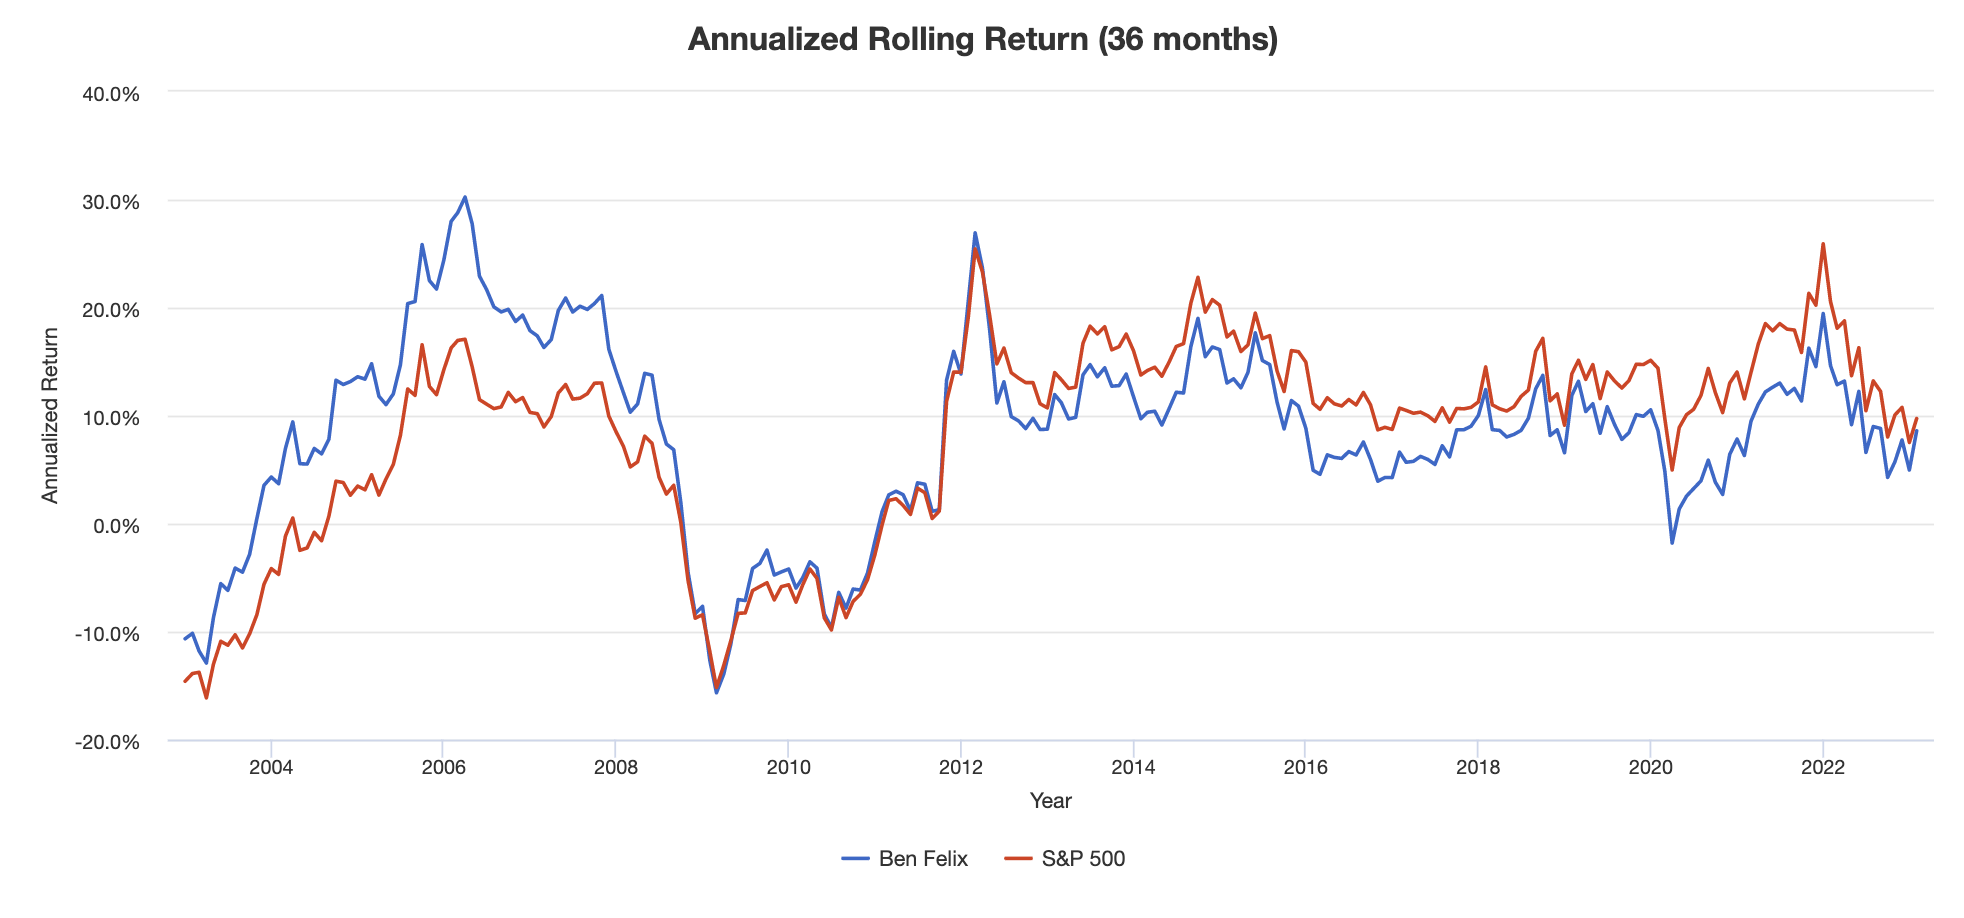
Ben Felix Model Portfolio ETF Pie for M1 Finance
M1 Finance is a great choice of broker to implement the Ben Felix Model Portfolio because it makes regular rebalancing seamless and easy, has zero transaction fees, and incorporates dynamic rebalancing for new deposits. I wrote a comprehensive review of M1 Finance here.Canadian investors can use Questrade, and those outside North America can use eToro.
Using mostly low-cost Vanguard funds and a couple relatively new funds from Avantis, we can construct a U.S. translation of the Ben Felix Factor Portfolio like this:
- VTI – 42%
- VEA – 24%
- VWO – 12%
- AVUV – 14%
- AVDV – 8%
You can add this pie to your portfolio on M1 Finance by clicking this link and then clicking “Save to my account.”
Disclosure: I am long VEA, VWO, AVUV, and AVDV in my own portfolio.
Interested in more Lazy Portfolios? See the full list here.
Disclaimer: While I love diving into investing-related data and playing around with backtests, this is not financial advice, investing advice, or tax advice. The information on this website is for informational, educational, and entertainment purposes only. Investment products discussed (ETFs, mutual funds, etc.) are for illustrative purposes only. It is not a research report. It is not a recommendation to buy, sell, or otherwise transact in any of the products mentioned. I always attempt to ensure the accuracy of information presented but that accuracy cannot be guaranteed. Do your own due diligence. I mention M1 Finance a lot around here. M1 does not provide investment advice, and this is not an offer or solicitation of an offer, or advice to buy or sell any security, and you are encouraged to consult your personal investment, legal, and tax advisors. Hypothetical examples used, such as historical backtests, do not reflect any specific investments, are for illustrative purposes only, and should not be considered an offer to buy or sell any products. All investing involves risk, including the risk of losing the money you invest. Past performance does not guarantee future results. Opinions are my own and do not represent those of other parties mentioned. Read my lengthier disclaimer here.

Are you nearing or in retirement? Use my link here to get a free holistic financial plan and to take advantage of 25% exclusive savings on financial planning and wealth management services from fiduciary advisors at Retirable to manage your savings, spend smarter, and navigate key decisions.

Great post! Curious as to why AVUV rather than VBR, given that VBR has significantly lower expense ratio?
I explained that here.
Hi John,
What do you think of a NTSX substitution for VTI in Ben Felix’s portfolio? Curious to know your thoughts. Would greatly appreciate if you showed how this change compares to the S&P 500 and the original Ben Felix portfolio. All the best.
Hey,
What about REITs held in the model portfolio? https://www.pwlcapital.com/wp-content/uploads/2023/10/2023-09_Model-Portfolios.pdf
I don’t see them mentioned in the article.
REITs are already inside total market index funds.
Hey John, I am trying to model the U.S. version of the portfolio as best I can within my 401k options. Here is what I came up with:
42% WFSPX IShares S&P500
24% SWISX Schwab International
14% DFSVX DFA SCV
12% FPADX Fidelity Emerging Markets
8% DISVX DFA International SCV
Since there are no specific “Developed Markets” funds available, I used SWISX there. Here is a list of my options if you think there is something I should change: https://www.401go.com/investments/
Thanks!
How often that portfolio must be rebalanced to initial proportions?
John, your own portfolio takes a more aggressive tilt towards small/value than Ben Felix. Can you explain why you’re taking a 1:1 ratio compared to the Ben Felix 3:1? Do you believe Ben is trying to minimize volatility and maximize risk adjusted return whereas you’re after general return?
Exactly what you said – I’m just choosing to take a more aggressive tilt. The PWL model portfolios are supposed to be fairly light tilts to avoid major tracking error regret.
Could you please share what’s the 3:1 ratio referring to? Value tilt, emerging market tilt?
Broad market to Value tilt.
I see, thanks for clarifying. If I wanted to follow 3:1 tilt, what do you think of this portfolio?
VT – 75%
AVUV – 15%
AVDV – 5%
AVES – 5%
Now that AVES and AVEM are available, would you consider replacing any of the above or exchanging the vanguard emerging market index?
AVEM doesn’t look materially different from something like VWO. AVES is very new but I’m keeping my eye on it.
Hello I really enjoyed going through most of your posts on this site it really helped me realize my portfolio should be more globally diversified, as a Canadian investor this is what I’m rolling with. Ben Felix has half his funds hedged and half not on the PWL website so I kind of kept the same idea going.
15% VSP – Hedged s&p 500
15% VUS – Hedged total US
15% AVDV – small cap value unhedged
10% IUSV – value unhedged
15% VCN – Total Canadian market
10% XEF – EAFE unhedged
10% VI – EAFE hedged
5% XEC – emerging unhedged
5% AVDV – intl. small cap value unhedged
And of course the obligatory 5% Hedgefundie lottery ticket not to be rebalanced.
Thanks!
Thanks, Sandy!
Thanks for the great, thorough analysis. I now fully understand why Ben recommends most investors keep it simple with something like Vanguard one-decisions funds (VASGX, VSMGX, etc). While this model does improve risk-adjusted returns, it’s probably more complicated and requires more maintenance than most investors would prefer.
It seems to me factors tilts only really makes sense for a 100% equities portfolio. For instance, the expected return of a factor tilted 80/20 portfolio is about the same as 100% equity index portfolio. While the factor tilted 80/20 portfolio will be less volatile, it still requires occasional re-balancing whereas auto re-balancing funds obviously don’t.
Definitely not. Don’t forget the diversification benefit from factor tilts.
Hi John, thanks for your detailed article & I’ve indeed learnt a lot from it as a Malaysian index investor. Also, in an attempt to further simplify the portfolio that you’ve shared, I’ve come up with below allocation & I would really appreciate to have your views on it.
VT – 78%
AVUV – 14%
AVDV – 8%
Thanks in advance for sharing your views with me.
Hey Jason, glad you’ve learned some things! Your simplified version sounds good. I personally prefer to overweight Emerging Markets like this model portfolio does.
Technically Felix didn’t overweight emerging markets. He chooses to use the MSCI index which includes South Korea. Of a portfolio holding an MSCI emerging market fund, 12% would be market weighted. Switching to VWO overweights EM.
Total ex-US international market is 3:1 DM to EM. This portfolio is a 2:1 ratio. Emerging Markets comprise roughly 10% of the global market by weight, close to the 12% you quoted, but Felix is obviously not aiming for global market cap weights here.
I have read your article with great interests, looks that Ben Felix Model Portfolio performed slightly better than SP500 for past 20 years, 8.2 vs 7.4 in CAGR, about 0.8% in annual return, also less volatile !
Have you tried to run backtesting for the 80/20 allocation you mentioned ?
Thanks
I have a similar portfolio at m1 finance.
40% vti (total us stock)
27% vxus (total ex us stock)
20% avuv (avantis us small cap value)
13% avdv (avantis ex Us small cap value)
Sounds good!
Are you aware that Ben Felix released an additional variation of this portfolio that uses active ETFs from Avantis for better tilting towards the factors? Did you consciously exclude that portfolio or were you unaware? It’s linked to in the description of a December 2020 podcast.
Ran across that one this morning actually. I must have been looking at the previous 2019 paper. I’ll be updating the post ASAP to reflect the most recent paper and model portfolio (and new ETFs).
I’ll have to dig in to the new paper, but at a glance I’m not sure why they ditched the U.S. large cap value tilt in favor of ex-US small value, as the former has paid a much greater premium historically.
In AVUV’s short lifespan of a little over 1 year, VIOV still has greater loading on Value and Investment. Will be interesting to see how these 2 play out over time.
Just updated it and included the Avantis ETFs in my small cap value discussion here. I think I actually prefer the old model portfolio from 2019 that had U.S. large cap value, and I think I still like DLS over AVDV for ex-US SCV exposure.
He mentioned in his podcast that they dropped the emphasis on large & mid-cap in favor of the factor tilt towards small-cap where the factors are more impactful. He wanted to keep things simpler and left the larger size factors out for that reason.
That seems sensible to me since the value factor is significantly more impactful with small caps.
This is exactly what I’ve been trying to build from scratch. This review and the corresponding links are very informative. You’re site has made getting into investing much easier. Thank you.
Really glad to hear it, Ben! Thanks for the kind words!
How would one go about doing a portfolio visualization (or another backtesting tool?) of this portfolio over a longer time duration, especially compared to the S&P 500 or the S&P completion index or a typical 60/40 portfolio? Additionally, what tickers did you use for the backtest? Portfolio Visualizer doesn’t appear to have data for VIOV going back that far.
Another concern is that I find the composition of 100% stocks is likely to be concerning to many investors, especially since the max drawdown appears larger than that of the S&P 500 over the same time period shown above.
You’d just need to find mutual fund equivalents or underlying indexes that go back further. I used the mutual fund equivalents in PV in this case; don’t remember what they are off the top of my head.
But yes, this portfolio as it stands is obviously better suited for a young investor with a high risk tolerance since it’s 100% stocks. It’s more of an illustration of how to structure the factor tilts. One could add bonds as needed as time goes on while still maintaining the factor tilts; just requires some math with fractions.
If you aren’t in 100% equities I’m not sure factor-tilting is worthwhile. For instance, a factor-tilted 80% equities/20% bonds portfolio will probably have similar expected returns as a standard 100% equity index portfolio. While the former is less volatile, it’s more complex and requires re-balancing.
I’m a little older (about 50) and currently have VASGX, a globally diverse 80/20 fund with auto-balancing. I like the idea of factor tilts, but am not sure I’d really benefit from them much at this stage of life.
Sure it is. Like I said, don’t forget the diversification benefit from factor tilts. The purported benefits don’t suddenly become inapplicable once bonds enter the portfolio.