OVL is an income ETF that holds U.S. large cap stocks with an option overlay for high monthly distributions. But is it a good investment? I review it here.
Disclosure: Some of the links on this page are referral links. At no additional cost to you, if you choose to make a purchase or sign up for a service after clicking through those links, I may receive a small commission. This allows me to continue producing high-quality content on this site and pays for the occasional cup of coffee. I have first-hand experience with every product or service I recommend, and I recommend them because I genuinely believe they are useful, not because of the commission I may get. Read more here.
In a hurry? Here are the highlights:
- OVL is a high-yield income-oriented ETF based on the S&P 500 that launched in 2019.
- OVL writes put spreads on the S&P 500 via VOO.
- As of late 2026, OVL has amassed nearly $500 million in assets and costs 0.79%.
- OVL's total absolute return has beaten the S&P 500 historically but its risk-adjusted return has lagged it.
- OVL has a beta of about 1.10, meaning it is basically 110% stocks. As such, it is more volatile than the S&P 500, meaning it will rise and fall to a greater degree.
- OVL had a modest dividend yield for about 5 years until it switched to high-yield monthly distributions as of January 2026.
- OVL is plainly holding VOO with about 99.8% of assets and the other 0.2% is the option strategy overlay, which is what you're paying for with the high fee.
- The overlay needs to earn at least 0.76% a year net of trading costs just to tie a plain VOO position.
- OVL is efficiently harvesting the volatility premium.
- OVL's distributions have been mostly ROC.
- High yield products exploit – and are attractive to amateurs as a result of – cognitive errors such as mental accounting bias and the naivete of unsophisticated, income-oriented investors.
- Income investors do not need high-yield products for income.
- Uninformed finfluencers push these high-yield, high-fee products on social media.
Contents
OVL ETF Quick Stats Table
Before we dive into the details on OVL, here's an overview of the quick stats:
| Name | Overlay Shares Large Cap Equity ETF |
| Ticker | OVL |
| Issuer | Liquid Strategies |
| Inception | 9/30/2019 |
| Strategy | VOO + short SPX put spreads |
| Expense Ratio | 0.79% |
| AUM | $466M |
| Distribution Rate | 10.41% |
| 30-Day SEC Yield | 0.94% |
| Payout Frequency | Monthly (since Jan 2026; quarterly before) |
Data as of September 2026.
Introduction – What Is OVL and How Does It Work?
OVL is the Overlay Shares Large Cap Equity ETF. As the name suggests, it holds large cap stocks and adds an option overlay, inside an ETF wrapper.
OVL has been around since 2019, quietly chugging along with a couple hundred million dollars and a modest yield that was nothing to write home about. Then at the end of 2025, it started paying out about 10% a year, monthly, and suddenly it's taken Twitter and Reddit and the financial blogosphere by storm, particularly in “income” communities.
I get it. “S&P 500 plus 10% income” sounds nice and innocent. In this review, I'm going to dig into what OVL actually holds, how its put spread options overlay works, what changed in late 2025, where that 10% yield really comes from, how it's taxed, what the research says about selling options, and whether it deserves a spot in your portfolio.
In short, OVL is an interesting fund with a typically-misunderstood distribution. Long version with details below.
You've probably heard of other S&P-based “income” funds that utilize covered call options like XYLD, SPYI, GPIX, etc., and I've got blog posts on some of them for which the verbiage is nearly identical because the strategies are extremely similar. Somewhat refreshingly, OVL is materially different from those. It uses an options strategy called put spreads.
In a nutshell, OVL holds the S&P 500 – comprised of U.S. large cap stocks – as most of the fund and then dedicates a small amount of space to its put spread options strategy (the “overlay”). As such, its name is very fitting.
The S&P 500 is pretty straightforward. Let's talk about what a put spread is.
OVL and Put Spreads – A Primer
Imagine you own a house. Every few days, your neighbor pays you a small fee in exchange for your promise to buy their house from them at a set price if housing prices crash before the end of the week. Most weeks, nothing happens and you pocket the fee. Occasionally, prices crash, and you're on the hook.
Now imagine you also bought yourself an insurance policy at the same time that says you'll never lose more than a set amount on that promise. That's a put spread. You sell one put option (collecting a premium), and you buy a cheaper put option at a lower price (spending some of that premium) to cap your worst case, hence a “spread” between puts.
OVL does this constantly on the S&P 500 index while also literally owning the S&P 500 via Vanguard's uber-popular VOO ETF.
When markets are calm or rising, the puts expire worthless, OVL keeps the premium, and you get a little extra return on top of the index.
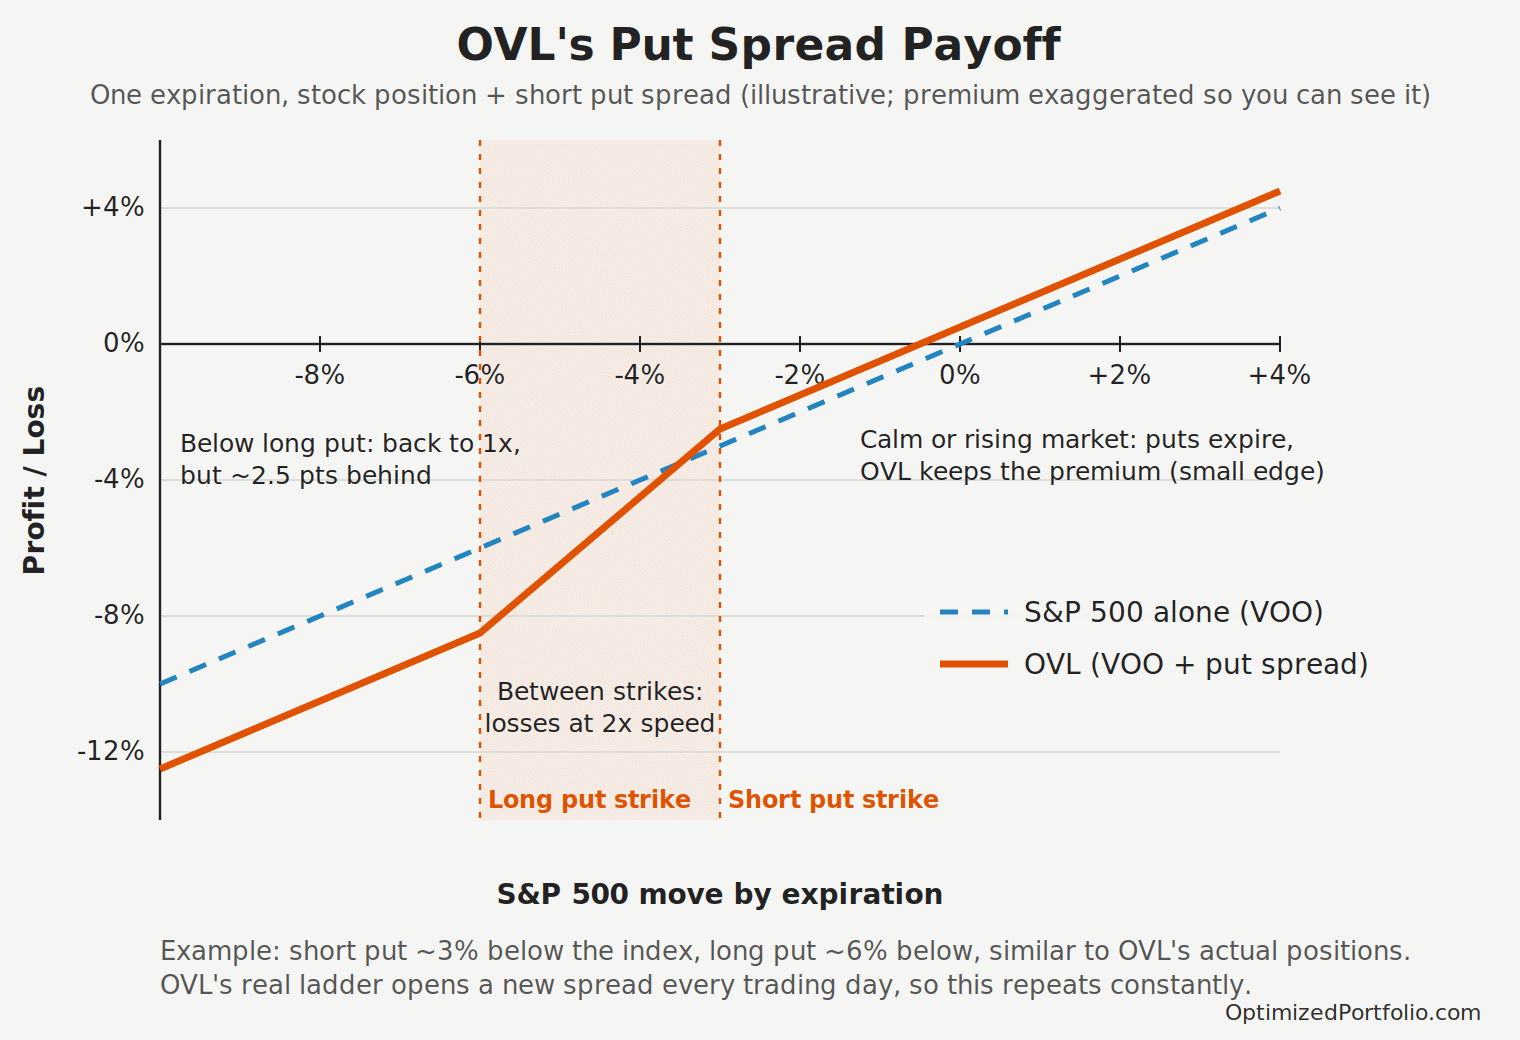
When markets drop sharply, the puts it sold lose money, and those losses stack on top of the losses in VOO. The puts it bought limit how bad each trade can get, but you're still falling faster than the index.
This is a pretty simple performance characteristic that many seem to miss. OVL is typically rising more than the market when the market rises but also typically falling more than the market when the market falls. We can express and measure this as what we call volatility, i.e. standard deviation of the return. OVL is demonstrably more volatile than the market. I'll go into detail on the specific implications of this later.
That's really the whole strategy. OVL gets paid in good times for agreeing to hurt a little extra in bad times. Covered calls, on the other hand, do sort of the opposite – they sacrifice some upside to get paid immediately and thus have a tiny cushion during drops.
The Details of OVL
For the options nerds who want the details, per the prospectus, OVL sells SPX puts with a notional value of up to 100% of net assets, typically expiring within a couple weeks, and buys an identical number of lower-strike puts. The options are European-style and cash-settled, so there's never any early assignment drama or shares changing hands.
The full VOO position stays in place underneath, so the overlay is layered on top of 100% equity exposure. This is different from other income funds where the equities comprise less of the total book. This is why OVL's beta ends up around 1.10.
The prospectus says the spread width is set based on the adviser's judgment of expected volatility, and that in declining markets the fund “may reduce its sale of Short Puts and/or purchase of Long Puts with strike prices closer to the strike prices of the Short Puts.” In other words, there's a human with their hand near the brakes. That's may be useful, but it also means OVL isn't purely mechanical.
Liquid Strategies explicitly targets about a 2% net return per year with the overlay. Keep that number in your head; it becomes important later.
Implications of Those Details
What that means in practice is a few things of note:
- OVL is using leverage, just not the borrowing kind. The fund doesn't use margin. But a short put has positive delta, so when the short strike is anywhere near the money, OVL's effective S&P 500 exposure is north of 100%. Again, its beta tends to hover around 1.10, so think larger swings aka more upside and also more downside. As an aside, this is why it should be no surprise that OVL has outperformed VOO during a bull market. You're getting a bit more than one dollar of stock market per dollar invested. The fund limits this under the SEC's derivatives rule using VAR, but the prospectus is pretty straightforward in stating that it “could still lose a significant amount or nearly all of its value” if the market moves enough. This too, should be unsurprising.
- Exposure is greater when you least want it. The corollary to what I just mentioned above – As the market falls toward the short strike, the short put's delta grows, which means OVL gets longer the S&P 500 as it drops. The long put eventually kicks in and flattens that out, but in the zone between the two strikes, you're effectively buying the dip on autopilot whether you wanted to or not. AQR researchers Roni Israelov and Lars Nielsen describe this dynamic in option-writing strategies as a hidden, uncompensated “equity reversal” bet.
- Loss cap is per trade, not per crash. Using a 2026 snapshot, each day's spread can lose at most around 0.7% of NAV. That sounds tidy until you remember a new spread gets opened every day. In a multi-week selloff, OVL can compound losses. The adviser can pull back as described above, but “defined risk” is true for each trade; it doesn't mean the strategy as a whole has a floor. The prospectus puts this plainly too: “the loss potential if the strategy is not effective may be greater than the profit potential.”
- Volatility spikes hurt even before prices fall. When implied volatility jumps, the puts OVL sold get more expensive even if the index hasn't moved, which immediately hits NAV.
- OVL is harvesting the volatility risk premium. Implied volatility on S&P 500 options has historically been higher than the volatility that actually shows up afterward. Investors pay up for crash insurance, and whoever sells that insurance earns the spread on average over time. That's the economic engine driving the strategy here.
OVL's Allocations
I mentioned OVL is basically VOO + options. You might be surprised to learn the percentages of each.
VOO itself literally comprises 99.8% of OVL. So with some hand waving, 0.2% of the fund is the option overlay, and that's what you're paying 0.78% for. Whether or not that's worth it long term remains to be seen, but so far OVL has been able to overcome that relatively high fee to beat its underlying (albeit with more volatility).
A significant chunk of the VOO shares themselves are pledged as collateral for the short puts. There's no idle cash sitting around to back the options, so the stocks are sort of doing double duty. That's partly why OVL ends up with more than 100% market exposure.
The official objective is still “total return.” The prospectus says OVL “seeks total return.” The fact sheet goes further and says the fund seeks “higher current income and total return than the S&P 500 TR Index.” It has indeed delivered on that so far.
Liquid Strategies
OVL comes from Liquid Strategies, LLC, an Atlanta-based firm founded in 2013. OVL launched on September 30, 2019 alongside four siblings (more on those later), and it's a series of Listed Funds Trust, with U.S. Bank handling custody and administration.
Liquid Strategies is run by two co-founders:
- Shawn Gibson, the firm's CIO, started as an options market maker at Timber Hill (the market-making arm that became part of Interactive Brokers) in 1997 and later ran options strategy at BB&T.
- Adam Stewart, CFA is the firm's Director of Trading, with stints at Franklin Templeton and as head of equity trading at Trusco Capital Management.
This is a team with real options experience running systematic strategies, which is honestly more than you can say for some of these “we bolted an options sleeve onto a thematic ETF” launches of the last few years.
OVL's Change To a 10% Monthly Distribution
The high yield is probably why you're interested in OVL in the first place and is likely why you ended up here.
For its first six years of life, OVL paid a modest quarterly distribution similar to VOO. The 2025 annual report describes the policy: the fund paid out the dividends from its underlying ETF plus 50 basis points per quarter “in anticipated income from the options overlay,” with the caveat that if the overlay “fails to generate 2% net return, some or all of the additional 50 bps may be return of capital.” In late 2025, its distribution yield was 3.06%.
Starting in January 2026, OVL switched to monthly distributions at roughly 10% annualized. The new prospectus added a sentence you should know: “The Fund expects to make monthly distributions regardless of its performance.”
Distribution rate sits slightly north of 10% as of September 2026.
This wasn't an OVL-specific decision but was rather implemented across the Liquid Shares lineup except for OVLH, making most of their funds now income-oriented.
Nothing else changed. The overlay language and strategy remained intact. Same VOO core, same short-dated SPX put spreads, same 100% notional limit, same managers, same fee. There was no reorganization, no new index, and no shareholder vote. The change basically simply showed up in the annual prospectus refresh and people took notice.
I think this is important to state plainly: The fund didn't suddenly get five times better at generating income. It just decided to pay out a lot more of its total return in cash on a fixed schedule. Everything under the hood is the same.
So the obvious question is why would they do this? I think the answer is pretty obvious. High-yield “income” funds are all the rage at the moment. The derivative-derived incomed ETF category has pulled in enormous flows over the past few years, and the income bros are screening primarily by yield, often not looking too far past that, if at all. A fund showing 3% doesn't make their list, but a fund showing 10% does. Cue Twitter, Reddit, and YouTube finfluencer mania…
And the switch has paid off handsomely. Check out the AUM trend:
| Date | OVL Assets |
|---|---|
| August 2025 | $169M |
| June 2026 | $309M |
| September 2026 | $466M |
This preference is expected and documented. Harris, Hartzmark, and Solomon explicitly mentioned this practice in their 2015 paper “Juicing the Dividend Yield: Mutual Funds and the Demand for Dividends,” noting that fund providers will deliberately “juice” the yield to specifically target unsophisticated, income-oriented investors.
Where Does the 10% Come From for OVL?
But where does the yield actually come from here with OVL?
A napkin math estimate of OVL's “earned” cash flow looks like this:
| Source | Rough Annual Contribution |
|---|---|
| S&P 500 dividends (via VOO) | ~1.1% |
| Minus management fee | -0.75% |
| Options overlay (adviser's target, net) | ~2% in a normal year |
| Total “earned” cash flow | roughly 2-3% in a good year |
| Distribution rate | ~10% |
As you can see, those numbers don't add up to 10%.
As such, most of the payout is return of capital, or ROC. As of Septemember 2026, Liquid Strategies disclosed that 100% of recent distributions were estimated to be return of capital.
This isn't really new. OVL has been paying ROC for years. So recent outcries haven't studied the fund's history. Its financial statements show:
| Fiscal year (ends Aug 31) | Total distribution per share | Return of capital portion | ROC share |
|---|---|---|---|
| 2021 | $1.25 | $0.00 | 0% |
| 2022 | $1.48 | $0.61 | 41% |
| 2023 | $1.19 | $0.96 | 81% |
| 2024 | $1.32 | $1.06 | 80% |
| 2025 | $1.53 | $1.25 | 82% |
So even the “modest” old 3% payout was mostly not income for tax purposes. The new policy just cranked the dial up from roughly 3% to roughly 10%.
The irony is I think previously before they switched to that massive yield, OVL arguably made more sense – effectively just juicing up the S&P to try to squeeze out a bit more total return, as it's done, but keeping a modest yield around 3%. But switching to 10% yield is what attracted the massive inflows.
Before the income bros get out the pitchforks, let's talk about ROC as it relates to OVL…
Flavors of ROC
ROC comes in 2 flavors, typically labeled “destructive” and “non-destructive.” You can probably guess what those mean.
As the name suggests, “destructive ROC” is when a fund pays out more than its total return, so NAV erodes over time, i.e. its distribution yield is greater than what it earns. You've probably seen the term “NAV erosion” thrown around. You're being handed pieces of your principal and calling it “income.”
On the other hand, as you can imagine, “non-destructive ROC” is when a fund pays out less than its total return, but the payout gets classified as ROC for tax purposes because the gains were never realized. NAV keeps growing and the fund just converted some paper gains into cash for you.
OVL is currently in the second camp.
Just don't think ROC itself is any significant benefit. You can see as much using the calculator below. I explained this calculator and what it's showing in a separate post here.
Return of capital delays your tax bill; it does not erase it. This tool tests whether that delay is worth more than the extra expense ratio of an ROC-heavy income fund, compared with a plain index fund portfolio where you sell shares to generate the same cash.
| Federal taxes paid | Income Fund | Index Portfolio |
|---|---|---|
| Before the final sale | ||
| At the final sale | ||
| Lifetime total |
The index portfolio's lower fees leave it with a larger ending balance, so its dollar tax bill can be higher. Use the annualized returns above, not the dollar totals, to compare the two.
- Same gross total return. Both portfolios earn the same return before fees. A covered-call fund's capped upside and any return gap versus the index portfolio are not modeled, so this isolates tax timing and fees only. This is the best case scenario assumption for the income fund over medium to long horizons.
- Index comparison fee is fixed at 0.05%. The comparison portfolio of traditional low cost index funds has a blended expense ratio of 0.05%.
- Same cash in hand. The index investor takes dividends and sells shares to match the income fund's payouts dollar for dollar each year.
- Income fund taxes. The ROC share of each payout lowers cost basis and is untaxed until basis hits zero. After that, the ROC share is taxed as a long-term capital gain in the year received, even if you never sell. The non-ROC share (3% at the default) is taxed as ordinary income every year, which is conservative because some of it could be taxed at lower rates.
- Index portfolio taxes. Dividends are taxed yearly at the long-term rate. Shares sold for income are taxed only on their gain portion (average cost basis).
- End of horizon. Everything is sold in the final year and the gain is taxed at the long-term rate. No step-up in basis at death, no state taxes, and payouts arrive at year-end.
OVL rarely sells VOO, and when shares get redeemed, it transfers VOO shares in-kind, meaning the gains thereof aren't taxable to the fund itself. The flows are pretty huge. The result is a portfolio that can grow a lot while generating very little taxable earnings, so distributions beyond its small dividend income tend to get labeled ROC.
When the S&P 500 is ripping like it has in recent years, paying out 10% leaves plenty of room for NAV to keep growing. The trouble comes in flat or down years. If the S&P 500 returns 0% and the overlay adds 2%, OVL still pays out roughly 10%, and NAV drops by about 8% plus fees. Again, distributions happen "regardless of its performance." Income investors will view this as a benefit, but you can see how it might not be such a great thing. A high fixed payout doesn't change your total return in any year; it just changes how much of your total return shows up as cash versus staying invested.
What follows naturally from that, which hopefully doesn't require too much explaining, is that if you want 10% paid monthly from VOO, you can just create your own dividend by owning $100k of VOO and selling $833 of it monthly, which costs you 0.03% instead of 0.79%.
Of course, in fairness, there's no option overlay there, which brings us back full circle to what I mentioned earlier. The distribution policy is purely marketing; the overlay is the actual product.
But you don't care about that, at least not yet, because OVL has been able to outperform VOO net of fees. More on that in a second. For now, let's talk about fees...
OVL Fees
OVL's prospectus fee table breaks down like this:
| Fee | Amount |
|---|---|
| Management fee (unified; adviser pays most operating costs) | 0.75% |
| Other expenses | 0.01% |
| Acquired fund fees (VOO's own expense ratio) | 0.03% |
| Total annual operating expenses | 0.79% |
A couple things to note here:
You'll sometimes see OVL's expense ratio listed as 0.75% or 0.76%. That's because the financial statements exclude acquired fund fees; the 0.79% in the prospectus is the all-in number you should use. Second, that 0.03% line is VOO's actual expense ratio. So you pay VOO's 0.03% plus another 0.76% for the overlay and the wrapper. On $100,000, the overlay costs you $760 a year, every year, in good markets and bad.
That sets a hurdle many OVL buyers might not consider. The overlay needs to earn at least 0.76% a year net of trading costs just to tie a plain VOO position. If it really does average about 2% net, you might be ahead by a point or so in a typical year. In a rough year for short volatility, you'll lag, which is what happened in 2025. The overlay lost about 0.90% gross, and OVL returned 14.61% on NAV versus 15.88% for the S&P 500.
The annual report's summary of FY 2025 provides some humorous optimism: "The Overlay performed above expectations despite a meaningful equity pullback in early 2025." Above whose expectations, exactly?
Trading costs aren't really a concern, at least. Bid-ask spreads have been around 0.05%, and volume is significant, because we're dealing with the most liquid index in the world.
Now we can look at performance, the section you're probably most interested in.
OVL ETF Performance vs. the S&P 500
Here's the reason OVL has been making waves and arguably earns some respect. Trailing returns are as follows:
| Period | OVL (NAV) | S&P 500 TR | Difference |
|---|---|---|---|
| YTD 2026 | 12.07% | 10.21% | +1.86% |
| 1 year | 26.22% | 22.32% | +3.90% |
| 3 years (annualized) | 22.15% | 20.61% | +1.54% |
| 5 years (annualized) | 13.59% | 13.41% | +0.18% |
| Since inception 9/30/2019 (annualized) | 17.28% | 16.43% | +0.85% |
And by calendar year, from the prospectus:
| Year | OVL | S&P 500 TR | Difference |
|---|---|---|---|
| 2020 | 19.65% | 18.40% | +1.25% |
| 2021 | 32.23% | 28.71% | +3.52% |
| 2022 | -22.06% | -18.11% | -3.95% |
| 2023 | 27.86% | 26.29% | +1.57% |
| 2024 | 27.66% | 25.02% | +2.64% |
| 2025 | 17.86% | 17.82% | [VERIFY] |
Plainly, the fund has done what it said it would do in most years, which puts it ahead of a lot of the options-income category. Most covered call funds have trailed the index by a wide margin over this stretch because they cap their upside in a raging bull market. OVL doesn't cap upside at all, which is undeniably a structural advantage over the covered call crowd, but just remember that comes at the cost of greater downside.
Here's OVL vs. VOO specifically:
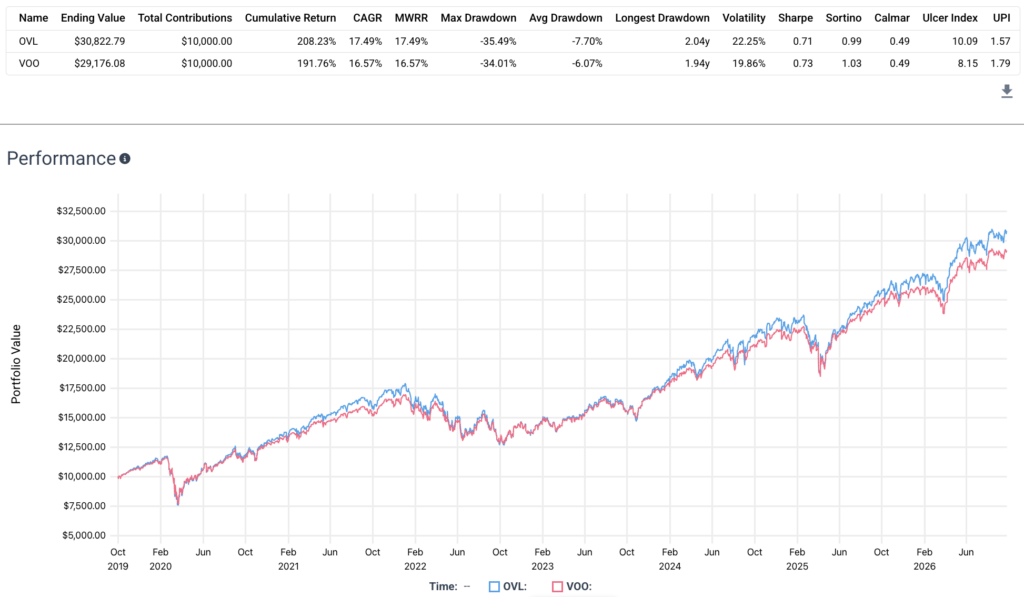
Let's talk about this performance in more detail. It's what we'd expect given the trades we've discussed - larger wins and larger losses. The income bros cavalierly just claim "OVL outperformed!" But we've got metrics for a truer apples-to-apples comparison that we call risk-adjusted return, or the return per unit risk, and they all still favor VOO.
A fund with more beta beat the S&P 500 in a raging bull market. Amazing! /s
In all seriousness, the risk stats tell the story:
- Volatility: 22.3% annualized for OVL versus 19.9% for VOO.
- Max drawdown: about -35.5% during the COVID crash in March 2020, worse than the S&P 500's roughly -34%.
- Sharpe, Sortino, and UPI all still favor VOO, which, again, we'd expect.
So is OVL's outperformance "alpha?" Maybe. A volatility premium is being harvested reasonably efficiently. But a large chunk of it, as I hinted at a few times already, is simply that OVL carried slightly more than 100% equity exposure during a period when equities went up a lot. You could get a similar result by holding about 110% of the S&P 500 using a leveraged ETF like UPRO combined with VOO and come out way ahead on fees:
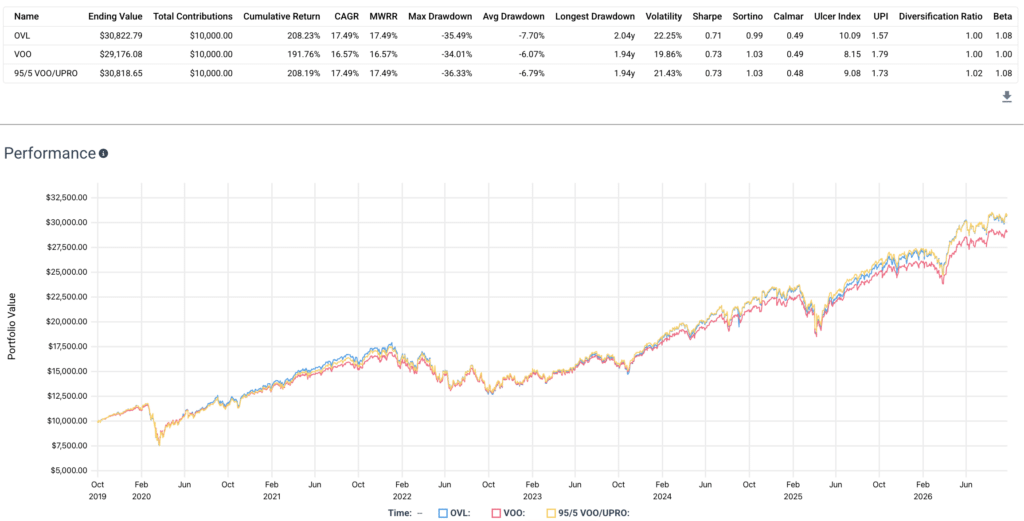
So in a nutshell, with OVL, you're basically getting VOO with more volatility and a huge distribution yield. We'll see what the future holds and whether or not OVL can continue to outperform net of fees. I think this is the kind of thing that works until it doesn't. It'll be interesting to see how OVL behaves in a bear market when those active human hands will be more hands-on.
If VOO is your default, OVL only wins if the overlay keeps earning more than 0.76% a year net and if you're comfortable with more downside in a crash. Most probably aren't.
OVL Tax Treatment
So how is OVL taxed? There are some nuances you should be aware of.
First, as I already hinted at it earlier, so far distributions have been mostly ROC, which just reduces one's cost basis until it hits zero.
The options themselves get Section 1256 treatment inside the fund, meaning 60% long-term cap gains and 40% short-term cap gains.
Qualified dividends are at risk. The prospectus warns that the option overlay "may prevent" the fund's income from qualifying for the lower qualified dividend tax rate, thanks to the tax straddle rules. In practice, FY 2025 worked out fine (100% of its small ordinary income distribution was designated qualified), but it's a material risk in future years, especially if option gains start flowing through as short-term income.
Remember that with distributions, ROC is an estimate, not a promise. Monthly Section 19(a) estimates have labeled 2026 distributions as 100% return of capital, but final characterization gets determined after the fiscal year ends on August 31 and shows up on your 1099-DIV.
This is probably going to depend heavily on how the overlay does in any given year. In a year like fiscal 2025, when the options lost money, there aren't enough taxable earnings to cover the payout, so most of it becomes ROC. In a strong year for the overlay, like the first half of FY 2026, more of it may end up taxable. I wouldn't hold your breath on 100% tax deferral.
As a reminder, when distributions are ROC, it isn't taxed on receipt but it lowers your cost basis, which means a bigger capital gain when you eventually sell. If your basis ever hits zero, future ROC is taxed as a capital gain.
Historically, OVL has been fairly tax-efficient. Tax drag has historically been about 0.7% annually for the highest federal bracket. Options can't be delivered in-kind, so heavy redemptions could occasionally force taxable gains.
As usual, in a tax-advantaged retirement account like an IRA or 401(k), none of this matters, and you're left with a 99.9% VOO fund charging 0.79%. If you're holding OVL in tax-advantaged space, the only argument for it is the overlay's expected profit.
What Investors Are Saying About OVL
Again, OVL hit my radar due to its recent popularity across finance social media, for better or worse.
As we'd expect, opinions on OVL split almost perfectly along the line between people who look at yield and people who look at total return.
The income crowd is obviously thrilled. Since the switch to monthly payouts, OVL has started showing up in the same conversations as SPYI, JEPI, GPIX, and the rest of the "high income S&P 500" gang. Seeking Alpha has a bullish piece from April 2026 highlighting the new 10%+ rate and pointing to the ROC as a tax-deferral feature. The appeal is easy to see: uncapped S&P 500 upside and a double-digit monthly check. In Reddit dividend communities, the sentiment seems to boil down to "Why wouldn't I just buy OVL instead of SPYI?"
The skeptics focus on cost and risk-adjusted returns, and rightfully so. Fred Piard wrote on Seeking Alpha in July 2025 that OVL was reaching its stated objective but called its risk/reward unconvincing compared to a plain index fund, citing the fee and a Sharpe ratio that didn't beat SPY. That was before the distribution change, and nothing about the change would alter his math. I'd probably agree on being unconvinced.
Bogleheads react the way you'd expect. "Why would I pay 26 times the expense ratio of VOO for VOO with extra crash risk bolted on?" is a polite way of putting it. Bogleheads appropriately tend to see options income funds as a way to sell novice investors something they don't understand at a price they wouldn't otherwise pay, and OVL's 10% headline feeds directly into that suspicion.
Options traders seem to respect it and then ask why they'd pay for it. In Reddit options trading communities, where selling put spreads on SPX is basically a hobby, the reaction to funds like OVL tends toward "neat, but I can do that myself." Fair enough, though most likely don't have a plan or the discipline to execute in the same way as a RIC.
The most common misconception across all of it appears to be treating the ~10% distribution rate as sustainable income yield. It's a payout policy funded mostly by equity gains, and it depends on the stock market continuing to cooperate. Rest assured, there will come a time when the S&P will be uncooperative.
Selling Puts - What the Research Says
Zooming out a bit, OVL isn't really doing anything exotic. Selling index options has been studied for decades.
Like I mentioned earlier, the volatility premium is real. Joshua Coval and Tyler Shumway's 2001 paper "Expected Option Returns" (Journal of Finance) found that buying S&P 500 puts has historically produced large negative returns, which is another way of saying selling them has been profitable on average. Peter Carr and Liuren Wu (Review of Financial Studies, 2009) documented a persistent, significant variance risk premium in S&P 500 options. Investors consistently overpay for crash insurance.
Moreover, put-writing indexes have looked good on a risk-adjusted basis. Robert Whaley's 2002 study of the CBOE BuyWrite Index and later work on the CBOE PutWrite Index found that systematic option selling has produced returns in the neighborhood of the S&P 500 with meaningfully lower volatility over long periods. Not quite the same thing, of course, as those strategies are cash-secured, whereas OVL holds 100% stocks plus short puts, so it adds volatility rather than reducing it.
Most of the risk is still the stock market. Equity exposure tends to dominate the behavior of option overlay funds. The overlay with OVL is a small return stream sitting on top of a much larger S&P 500 position. The overlay can be observably good and still be a minor factor in what you actually experience as an OVL holder, which will, once again, mostly be a slightly louder S&P 500.
Notably, nothing in the literature suggests that any of this reliably produces 10% a year in income on top of equity returns.
Who Should (and Shouldn't) Buy OVL
OVL makes the most sense for an investor who understands exactly what a short put spread does, specifically wants a volatility risk premium tilt on top of their S&P 500 exposure, and is willing to pay 0.79% to have someone else roll a ladder of them often. Holding it in a taxable account adds some potential ROC deferral as a bonus. If you also happen to want monthly cash flow and understand that it's mostly your own gains being handed back, fine.
OVL makes much less sense if the 10% number is the reason you're interested, which seems to be most of the investors I encounter discussing this fund.
If you need income from your portfolio, you can generate it from any fund by selling shares, and the fund's payout policy won't change your total return one bit. It also makes little sense as a hedge (t's the opposite of one), as a diversifier (it's not one), or as your core S&P 500 holding (VOO exists at 0.03%).
For retirees, I'd be especially cautious. A fixed ~10% distribution "regardless of its performance" can look wonderful for years and then quietly eat NAV during a flat decade. The early 2000s produced exactly that kind of decade for the S&P 500. Don't succumb to recency bias and optimism bias. Despite what finfluencers will tell you, sequence risk doesn't care what the fund calls its payout.
Is OVL a Good Investment?
So is OVL a good investment? Maybe.
If OVL continues to impress with outperformance, then one could make the argument that it's worth it. But of course the future is unknowable.
The irony is investors looking for "income" typically want more stability than the market, not less. OVL is potentially greater gains at the potential cost of greater losses. Again, the huge yield is marketing, not mechanics. I'd probably rather create my own dividend when I want one and conveniently pay a much lower fee to just own VOO and maybe some T-bills.
No de-risking is happening here, unlike with covered call products. Quite the opposite. OVL is expected to rise more than the market when it rises and fall more than the market when it drops.
Again, OVL is doing what it promises to do. I just suspect most investors don't really need what it offers and are instead lured by the juicy yield figure; just look at that asset growth trend. I'll be curious to see if assets drop off if OVL sees an extended period of underperformance.
I remain unconvinced, but I'm biased in that I tend to line up with Bogleheads in shying away from truly active management and short-term options trading.
I also don't really see the use case. To reiterate what I noted earlier, the investor who really needs regular reliable income probably shouldn't be using 110% stocks, and the accumulator who wants 110% stocks doesn't need income. In that sense, it feels like a contradiction. I'd also rather create my own dividend when I want anyway, as I hinted at earlier.
ROC means tax-deferred, not tax-free. Someone selling shares of VOO is only taxed on the gains portion. OVL's fee drag may outweigh those tax deferral savings if Liquid Strategies are not consistently able to overcome that hurdle rate with the overlay. Once your cost basis is wiped out after about a decade, the OVL distribution receiver and the VOO liquidator are going to be roughly equal on the tax dimension. The advantage of ROC deferral is smaller than many make it out to be.
Generally speaking, I often encourage people to get away from this fanciful idea that one must own a high-yield product for income. This irrational preference for yield would be comical at this point if it weren't so concerningly pervasive, particularly among novices.
Again, OVL may end up being fine, but complex, high-fee, high-yield products like this provide the opportunity for uninformed finance social media grifters to push them on unsuspecting novices using the allure of "passive income" by simply highlighting juicy yields without fully understanding what they're promoting.
In any case, don't miss the glaring fact that historical performance adjusted for risk still favors the plain underlying VOO, at least at this time in late 2026. Annoyingly, income bros do indeed tend to miss or selectively ignore that fact.
How OVL Could Fit in a Portfolio
Even though doing so isn't very rational, I'd treat OVL as a satellite simply to avoid betting the whole farm on it. Just be aware that owning it increases your effective equity exposure a bit and adds tail risk to the part of your portfolio that already has the most of it. I maintain that many already don't have the stomach for 100% stocks. This is basically 110% stocks.
If you're currently in a covered call fund and bothered by how much upside you've given up in recent years, OVL is arguably a more sensible way to collect option premium, since it doesn't cap gains. Just know that you're trading upside drag for downside amplification (see 2022).
Recap
That was a lot. Let's recap:
- OVL is a high-yield income-oriented ETF based on the S&P 500 that launched in 2019.
- OVL writes put spreads on the S&P 500 via VOO.
- As of late 2026, OVL has amassed nearly $500 million in assets and costs 0.79%.
- OVL's total absolute return has beaten the S&P 500 historically but its risk-adjusted return has lagged it.
- OVL has a beta of about 1.10, meaning it is basically 110% stocks. As such, it is more volatile than the S&P 500, meaning it will rise and fall to a greater degree.
- OVL had a modest dividend yield for about 5 years until it switched to high-yield monthly distributions as of January 2026.
- OVL is plainly holding VOO with about 99.8% of assets and the other 0.2% is the option strategy overlay, which is what you're paying for with the high fee.
- The overlay needs to earn at least 0.76% a year net of trading costs just to tie a plain VOO position.
- OVL is efficiently harvesting the volatility premium.
- OVL's distributions have been mostly ROC.
- High yield products exploit - and are attractive to amateurs as a result of - cognitive errors such as mental accounting bias and the naivete of unsophisticated, income-oriented investors.
- Income investors do not need high-yield products for income.
- Uninformed finfluencers push these high-yield, high-fee products on social media.
If you want to buy OVL, it should be available at any major broker, including M1 Finance, which is the one I tend to suggest around here.
What do you think of OVL? Do you own it? Let me know in the comments.
Are you nearing or in retirement? Use my link here to get a free holistic financial plan and to take advantage of 25% exclusive savings on financial planning and wealth management services from fiduciary advisors at Retirable to manage your savings, spend smarter, and navigate key decisions.

Disclaimer: While I love diving into investing-related data and playing around with backtests, this is not financial advice, investing advice, or tax advice. The information on this website is for informational, educational, and entertainment purposes only. Investment products discussed (ETFs, mutual funds, etc.) are for illustrative purposes only. It is not a research report. It is not a recommendation to buy, sell, or otherwise transact in any of the products mentioned. I always attempt to ensure the accuracy of information presented but that accuracy cannot be guaranteed. Do your own due diligence. I mention M1 Finance a lot around here. M1 does not provide investment advice, and this is not an offer or solicitation of an offer, or advice to buy or sell any security, and you are encouraged to consult your personal investment, legal, and tax advisors. Hypothetical examples used, such as historical backtests, do not reflect any specific investments, are for illustrative purposes only, and should not be considered an offer to buy or sell any products. All investing involves risk, including the risk of losing the money you invest. Past performance does not guarantee future results. Opinions are my own and do not represent those of other parties mentioned. Read my lengthier disclaimer here.
Are you nearing or in retirement? Use my link here to get a free holistic financial plan and to take advantage of 25% exclusive savings on financial planning and wealth management services from fiduciary advisors at Retirable to manage your savings, spend smarter, and navigate key decisions.


Thanks for your excellent “deep-dive” on OVL. I’m retired and 17.5% of my portfolio consists of Covered Call ETFs. As you correctly surmised, my interest was piqued by social media after OVL increased the dividend to 10% in 2026. I had doubts that OVL could maintain its out-performance after this increase, but OVL’s price return in 2026 has rivaled those of my best performing CC ETFs (ie; GPIQ & GPIX). For this reason, I’m adding OVL to my portfolio with an allocation of 2.5%.
Due to the issues highlighted in your article, I will carefully monitor the performance of OVL relative to my other CC ETFs. The higher volatility of OVL relative to VOO doesn’t bother me because several of my CC ETFs are based on QQQ, which causes those ETFs to have higher volatility than OVL. As a whole, my entire group of CC ETFs performed relatively well during the 2022 bear market. We shalll see if that can continue.
Disclosure: About 80% of my portfolio is in Growth or Thematic ETFs, which more than make up for the underperformance of my CC ETFs. I use the dividend income to enhance my lifestyle. Everything is in a Roth IRA so I don’t worry about the tax treatment. Thanks again for the informative article.