The Ivy Portfolio from Meb Faber is based on the endowment funds of Ivy League schools. Here we’ll take a look at its components and the best ETFs to use in its construction.
Interested in more Lazy Portfolios? See the full list here.
Disclosure: Some of the links on this page are referral links. At no additional cost to you, if you choose to make a purchase or sign up for a service after clicking through those links, I may receive a small commission. This allows me to continue producing high-quality content on this site and pays for the occasional cup of coffee. I have first-hand experience with every product or service I recommend, and I recommend them because I genuinely believe they are useful, not because of the commission I may get. Read more here.
Contents
Video
Prefer video? Watch it here:
What Is the Ivy Portfolio?
The Ivy Portfolio is the product of the famous Meb Faber researching the highly-successful endowment funds of Harvard and Yale. He presents a simple, equally weighted portfolio that any investor can use to replicate the same asset allocations with low-cost ETFs. You can get the book here. I'd also highly recommend his book Global Asset Allocation: A Survey of the World’s Top Asset Allocation Strategies.
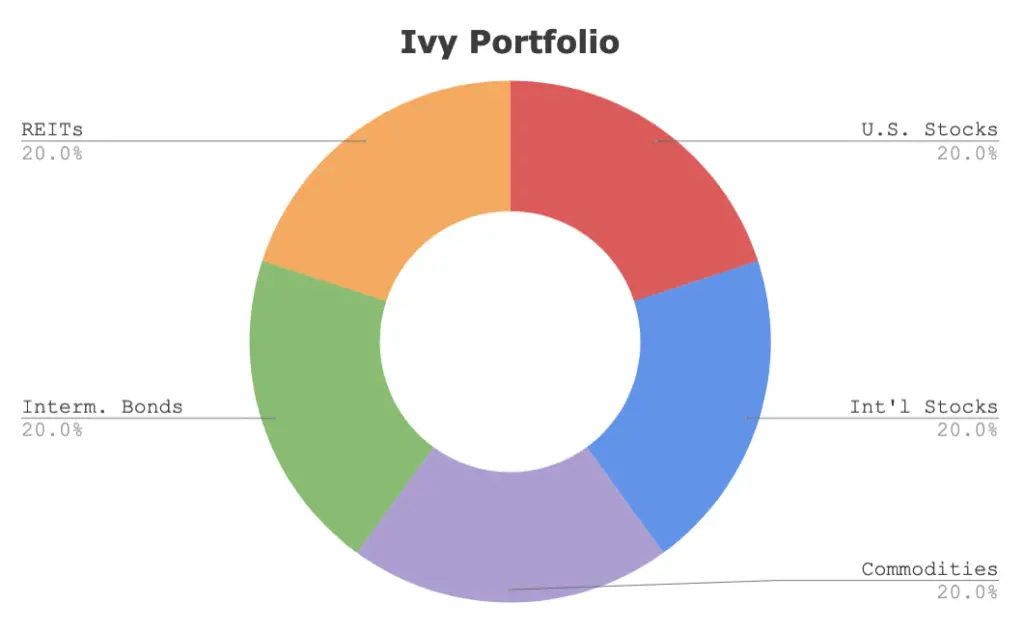
The Ivy Portfolio looks like this:
- 20% Total U.S. Stock Market
- 20% International Stock Market
- 20% Intermediate Bonds
- 20% Commodities
- 20% REITs

I'd be hesitant with the high allocations to commodities and REITs, considering the idiosyncratic risk of the real estate market and commodities' very poor historical performance, but these pieces should help lower the portfolio's volatility and risk. Endowment funds are more concerned with that objective than with maximizing returns, as their time horizon is perpetual.
Ivy Portfolio Performance
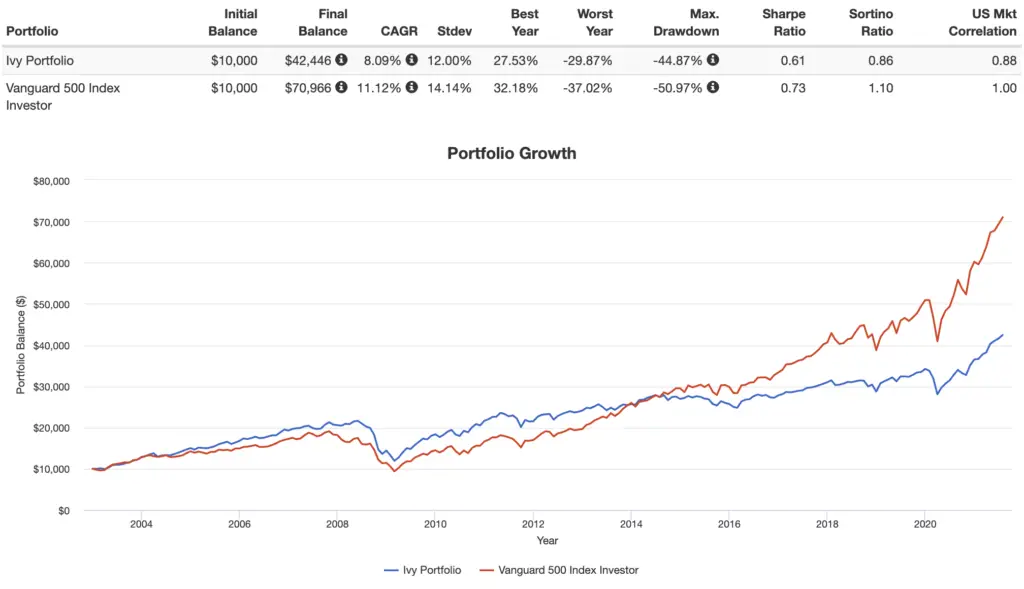
Going back to 2002, the Ivy Portfolio's performance has been pretty dismal compared to the S&P 500:

This isn't very surprising. I've explained elsewhere why we wouldn't expect commodities to deliver a positive real return, and this portfolio allocates 20% to them.
Unfortunately, the Ivy Portfolio's volatility and max drawdown aren't terribly different from that of the S&P 500. This is because intermediate bonds at a 20% allocation don't have much protection to offer. This piece should almost certainly be long term bonds, as more volatile assets make better diversifiers, especially when we've got 40% in stocks and 20% in REITs.
As a result, for this time period, the Ivy Portfolio still even had a lower risk-adjusted return (Sharpe), a measure of return per unit of risk, than the S&P 500. Investors interested in this type of well-diversified, risk-mitigating portfolio may be more interested in what I'd say are superior options:
Ivy Portfolio ETF Pie for M1 Finance
M1 Finance is a great choice of broker to implement the Ivy Portfolio because it makes regular rebalancing seamless and easy, has zero transaction fees, and incorporates dynamic rebalancing for new deposits. I wrote a comprehensive review of M1 Finance here.
Utilizing mostly low-cost Vanguard funds, we can construct the Ivy Portfolio pie with the following ETF’s:
- VTI – 20%
- VXUS – 20%
- VGIT – 20%
- PDBC – 20%
- VNQ – 20%
You can add the Ivy Portfolio pie to your portfolio on M1 Finance by clicking this link and then clicking “Add to Portfolio.”
Canadians can find the above ETFs on Questrade or Interactive Brokers. Investors outside North America can use Interactive Brokers.
Are you nearing or in retirement? Use my link here to get a free holistic financial plan and to take advantage of 25% exclusive savings on financial planning and wealth management services from fiduciary advisors at Retirable to manage your savings, spend smarter, and navigate key decisions.
Disclosures: I am long VTI and VXUS in my own portfolio.
Interested in more Lazy Portfolios? See the full list here.
Disclaimer: While I love diving into investing-related data and playing around with backtests, this is not financial advice, investing advice, or tax advice. The information on this website is for informational, educational, and entertainment purposes only. Investment products discussed (ETFs, mutual funds, etc.) are for illustrative purposes only. It is not a research report. It is not a recommendation to buy, sell, or otherwise transact in any of the products mentioned. I always attempt to ensure the accuracy of information presented but that accuracy cannot be guaranteed. Do your own due diligence. I mention M1 Finance a lot around here. M1 does not provide investment advice, and this is not an offer or solicitation of an offer, or advice to buy or sell any security, and you are encouraged to consult your personal investment, legal, and tax advisors. Hypothetical examples used, such as historical backtests, do not reflect any specific investments, are for illustrative purposes only, and should not be considered an offer to buy or sell any products. All investing involves risk, including the risk of losing the money you invest. Past performance does not guarantee future results. Opinions are my own and do not represent those of other parties mentioned. Read my lengthier disclaimer here.

Are you nearing or in retirement? Use my link here to get a free holistic financial plan and to take advantage of 25% exclusive savings on financial planning and wealth management services from fiduciary advisors at Retirable to manage your savings, spend smarter, and navigate key decisions.


Thanks, John, for the great insights here. I really appreciate all the work you’ve done and so graciously share with the rest of us.
Quick observation:: The Ivy Portfolio as described in Faber’s book is not fully “lazy” (passive) — the investor is directed to calculate the 10-month simple moving average (SMA) of each asset class based on the closing price of the associated ETF on the last trading day of each month, then exit the position into cash if that price dips more than -1% of the 10-month SMA. You re-enter the position when it crosses the 10-month SMA by more than +1%. This long-term trend following is designed to keep the positions away from the largest drawdowns. Faber freely admits it can keep you out of the biggest part of the certain upswings, too, but he is solidly of the “to win, first of all, don’t lose” mindset with this approach.
Do your return calculations account for the “active management” of these entry and exit points for the ETFs or do they reflect a “buy and hold” (truly “lazy”) approach to running the portfolio?
One more point: There are two variants of the basic five-asset class Ivy Portfolio; one with ten asset classes and another with twenty. It might be interesting to see how those fare in comparison to the “Ivy 5” approach described here.
Thanks for the kind words, William!
Returns here do not reflect any active management.
I’ll look into those other portfolios.
When you give CAGRs, please specify the actual date of start and the actual date of stopping. Other than that, this is very helpful
Hey Thomas,
The performance backtest above from Portfolio Visualizer is using annual returns from Jan. 1, 2007 through Dec. 31, 2019.