Financially reviewed by Patrick Flood, CFA.
The Golden Butterfly Portfolio is a medium-risk portfolio similar to Ray Dalio's All Weather Portfolio. Here we'll look at its theory, allocation, historical performance, and the best ETF's to use in its construction.
Interested in more Lazy Portfolios? See the full list here.
Disclosure: Some of the links on this page are referral links. At no additional cost to you, if you choose to make a purchase or sign up for a service after clicking through those links, I may receive a small commission. This allows me to continue producing high-quality content on this site and pays for the occasional cup of coffee. I have first-hand experience with every product or service I recommend, and I recommend them because I genuinely believe they are useful, not because of the commission I may get. Read more here.
Contents
Golden Butterfly Portfolio Review Video
Prefer video? Watch it here.

What Is the Golden Butterfly Portfolio?
The Golden Butterfly Portfolio is essentially a modified version of the Permanent Portfolio. It was designed by Tyler of PortfolioCharts.com.
Tyler named it after the metaphor of a butterfly – something that emerges from a constrained state and can move gracefully in any direction. The “golden” refers both to the gold component and to the aspiration of a kind of golden outcome regardless of what the economy is doing. He first published it on PortfolioCharts.com in September 2015.
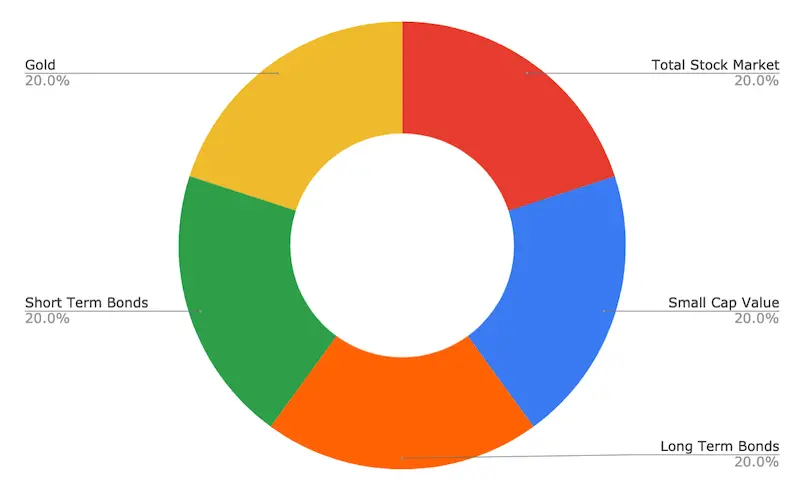
Golden Butterfly Portfolio Allocation
The Golden Butterfly Portfolio allocation looks like this:
- 20% Total US Stock Market
- 20% US Small Cap Value
- 20% Long-Term Treasury Bonds
- 20% Short-Term Treasury Bonds
- 20% Gold
Opining on Those Allocations
Tyler maintains that the Golden Butterfly Portfolio “goes against conventional investing wisdom.” I wouldn't really go that far. We know that Small Cap Value has historically paid a risk premium and gets us exposure to the Size and Value factors, small- and mid-caps have beaten large-caps historically, short-term treasury bonds are a cash equivalent, and long-term treasury bonds tend to be the best diversifier to hold alongside stocks (and thus are usually a very good hedge/insurance for a stock crash).
The only real point of contention in my opinion is the pretty heavy allocation to gold. I'm personally not a big fan of gold. It has a nonnegative correlation to stocks, albeit low/small, is much more volatile than bonds, is not a value-producing asset (it has a real expected return of zero), and has not been a reliable inflation hedge historically.
That said, gold is typically uncorrelated to both stocks and bonds, offering a diversification benefit to lower the portfolio's volatility and risk. Basically, we'd expect to sacrifice some return for a lower risk profile. This may be a perfectly sensible and desirable tradeoff for the risk-averse investor.

In 2026, the Golden Butterfly Portfolio has also been getting a bit more buzz in recent years and especially last year in 2025 with gold performing surprisingly well and small cap value doing pretty well also.
Your excitement – or lack thereof – over gold also depends on your view of monetary policy. I'm personally of the mind that monetary policy in the United States is fundamentally different post-Volcker (1982), in that we now know which levers to pull and which levers not to pull in order to avoid a runaway inflationary environment like we saw in the late 1970's, when bonds suffered and gold did well.
I would argue that for a young investor with a long time horizon and a high tolerance for risk, holding gold only creates the opportunity cost of holding something else in its place with greater expected returns, like more stocks. That said, again, I'll concede that it may offer a short-term diversification benefit and the metal does seem to reliably hedge against currency devaluation, making for safer withdrawal rates in retirement, so adopting the Golden Butterfly Portfolio may very well be a prudent move at or near retirement, or for a risk-averse investor who wants to cover all bases for all environments to minimize volatility and risk.
I talk about this gold piece in much more detail later below.
Golden Butterfly Portfolio Performance
So naturally, you're curious about the performance of the Golden Butterfly Portfolio. Its stats are impressive.
Over roughly the past half-century, it has delivered right under a 10% CAGR with volatility of only about 8%. That's roughly half the volatility of the S&P 500 over the same period, putting the Sharpe ratio of the Golden Butterfly Portfolio at 0.67 about 60% higher than the S&P 500. Max drawdown was also less than half the magnitude, illustrating the power of broad diversification.
Take a sec to appreciate just how impressive this performance is. The Golden Butterfly has historically delivered roughly 93% of the S&P 500's CAGR with half the volatility and roughly 35% of the maximum drawdown.

Impressively, the GBP also handily beat the classic 60/40 portfolio on all these metrics as well.
How Did the Golden Butterfly Portfolio Handle Major Market Events?
Let's briefly explore the downside further, which is really what the portfolio is built for. The whole point of holding gold, two different bond durations, and small cap value alongside total market stocks is to have something always working when everything else is on fire. I pulled some data for individual years:
| Period | Golden Butterfly | S&P 500 |
|---|---|---|
| Oil crisis, 1973 | +5.4% | -14.7% |
| Oil crisis, 1974 | +5.0% | -26.5% |
| Dot-com bust, 2000 | +8.0% | -9.6% |
| Dot-com bust, 2001 | +3.4% | -11.7% |
| Dot-com bust, 2002 | +2.9% | -22.1% |
| Financial crisis, 2008 | -4.6% | -36.8% |
| 2022 bear market | -12.9% | -18.2% |
| 2025 (gold surge year) | +19.3% | +17.7% |
All figures approximate.
First we've got the Nixon-era crash of 1973-1974. Notice how the S&P sank while the GBP stayed afloat nicely with moderate returns both years around 5%.
The dot-com era was arguably the Golden Butterfly Portfolio's finest hour, with three consecutive positive years while the S&P 500 lost roughly 38% cumulatively. If you were retiring in 2000 with a stock-heavy portfolio, that sequence of returns was genuinely catastrophic.
2008 was another obvious shining year for the GBP, being down only about 5% while the S&P lost 37% in the Global Financial Crisis. Bonds and gold did exactly what they were supposed to do, providing a major cushion.
2022 was the portfolio's worst modern stress test, and it arguably exposed a real structural weakness. Stocks fell, and long-term bonds fell even harder (TLT was down roughly 31% for the year). Gold was basically flat. When two of your five components get simultaneously hit, the others have to carry unusual weight. The result was approximately -12.9% for the portfolio.
That's still better than the S&P 500's -18.2%, and the portfolio recovered by roughly mid-2024. But the older, impressive “max drawdown of around 11%” figures you'll sometimes see cited reflect data that predates 2022. The actual maximum drawdown is now closer to -18%, depending on the measurement period and ETF proxies used.

For those of us who spent much of the 2010s and early 2020s questioning gold's contribution to this portfolio, 2025 was a humbling year.
Gold rose approximately 64% in 2025, its biggest annual gain in 46 years. As a result, the Golden Butterfly Portfolio delivered approximately +19.3% in 2025, outperforming the S&P 500's +17.7% for the first time in a while. That 20% gold allocation – the part most people argue about – contributed roughly 10+ percentage points of that return by itself. This came on the heels of 2024, when gold posted its best year since 2010 (+25.5%).
The analytically interesting part is the gold surge wasn't being driven by CPI inflation, which had largely come back down by 2024-2025. It was seemingly driven by structural demand – central banks worldwide, particularly China, India, and Turkey, purchasing over 1,000 tonnes of gold per year for the third consecutive year as part of a broad de-dollarization of reserve assets. Global central bank gold holdings reached roughly 36,200 tonnes, moving from about 15% of official reserves to roughly 20%.
This all brings us back to a distinction I find increasingly useful when thinking about gold in this portfolio (or in any portfolio, I guess). I say it all the time: Gold is not a reliable inflation hedge. And the academic research on this is pretty clear. Erb and Harvey, writing in the Financial Analysts Journal in 2013, found that only about 16% of gold's price variation since 1971 can be explained by CPI changes.
But gold does appear to usually function reasonably well as a hedge against uncertainty, monetary disorder, and currency debasement. Those are different things, and conflating them leads to confused expectations about when gold is actually supposed to show up to save the day.
In 2022, when actual CPI hit 9.1%, gold was essentially flat. In 2025, when inflation was largely under control but global reserve diversification was accelerating, gold surged over 60%. I'll let you draw your own conclusions.
The practical takeaway is that 2025 was a meaningful out-of-sample validation of this portfolio's composition that Tyler couldn't have specifically anticipated when he published it in 2015. It doesn't prove the gold allocation will always work this well; a decade of gold doing approximately nothing (see 2012-2018) is a completely plausible future scenario. But it does demonstrate that the 20% gold position isn't purely dead weight, even if its timing and mechanism aren't always predictable and don't always match the headlines.
Golden Butterfly Portfolio vs. Permanent Portfolio
The premise of the Permanent Portfolio is to utilize assets that perform well in four economic conditions: expansion (stocks), recession (cash or short-term bonds), inflation (gold; debatable), and deflation (long-term treasury bonds). The Golden Butterfly Portfolio simply takes those same assets and specifically adds Small Cap Value, a move that I'm a fan of.
This invariably makes the GBP comparatively more “aggressive” than the Permanent Portfolio, but we're still talking about a relatively low-volatility, all-seasons portfolio. Adding small-cap value conveniently means greater expected returns and a diversification benefit from the Size and Value factors being lowly correlated to market risk (beta).
In taking up a larger stocks position, we're also tilting toward an expansionary economic environment. I'm definitely okay with this; the economy grows more than it declines. Your adoption thereof may depend on your economic outlook.
Here's a backtest from 1968 through March 2026 comparing the Golden Butterfly Portfolio and the Permanent Portfolio:
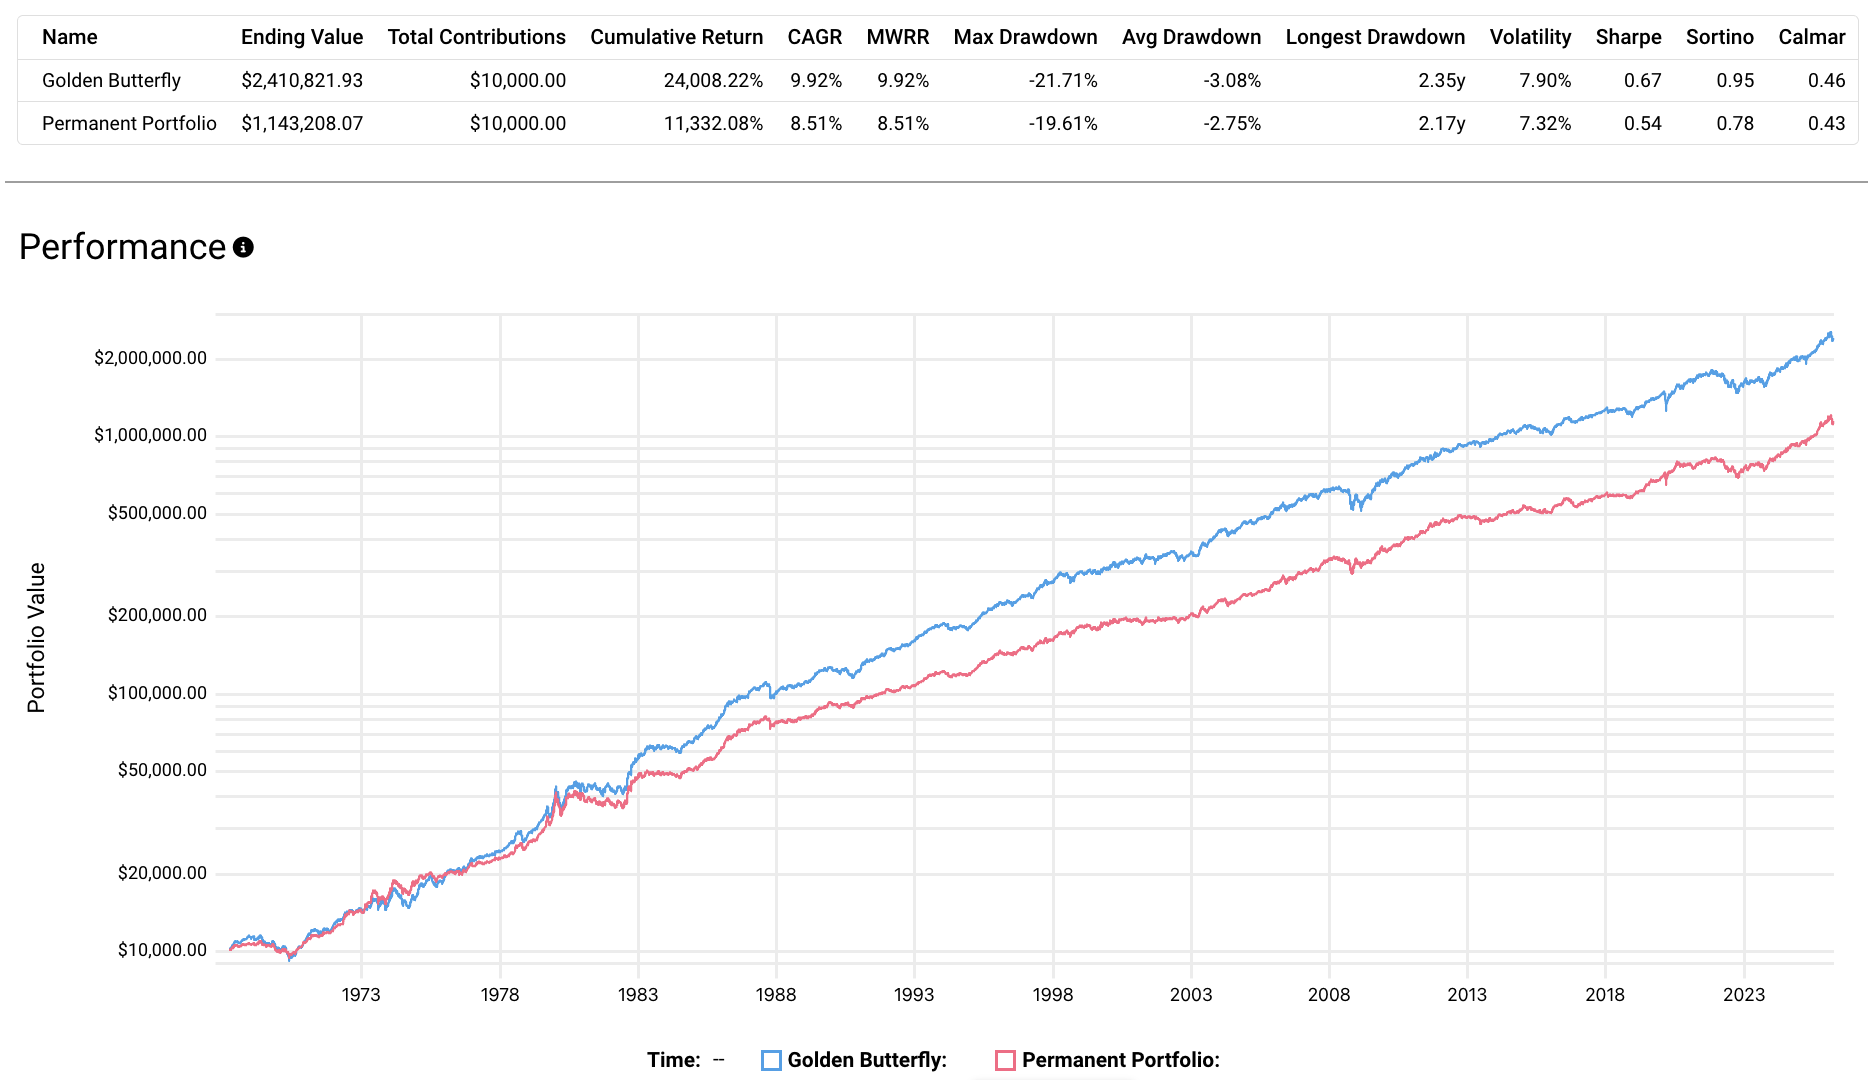
As we'd expect, we see a greater CAGR and Sharpe (risk-adjusted return) for the Golden Butterfly, with slightly more volatility and a larger max drawdown. This is due again to its inclusion of small cap value stocks. Looking at the Sharpe ratios, a measure of risk-adjusted return, we can see that we were better compensated per unit of “risk” by going with the Golden Butterfly Portfolio.
I'd definitely take the Golden Butterfly over the Permanent Portfolio. Again, I like small cap value stocks, and I don't want the Permanent Portfolio's extra 5% in gold.
Golden Butterfly Portfolio vs. All Weather Portfolio
Compared to Ray Dalio's All Weather Portfolio, we're talking about more gold, more stocks, and less treasuries with the GBP. Like the All Weather, the Golden Butterfly Portfolio is designed to “weather” any storm by utilizing diversification.
As mentioned, the Golden Butterfly Portfolio tilts toward economic expansion. Dalio chooses to be a little more market-agnostic with the All Weather Portfolio, admitting that we don't know what the future will hold. Unfortunately, while this provides a lower risk profile similar to the Permanent Portfolio, it has tended to drag down the portfolio's returns a bit over the long term, particularly due to its inclusion of broad commodities.

Results have been very close for that time period. Just like we saw with the Permanent Portfolio, with the Golden Butterfly we have a very slightly higher risk profile, but we're compensated for that greater risk in the form of higher general and risk-adjusted returns.
You'll notice that the All Weather Portfolio was ahead basically the first half of the backtest above, and the GBP outperformed in the second half. This was due to slightly more stocks and bonds – and less gold – in the AWP.
Who Is the Golden Butterfly Portfolio For?
So who should actually use the Golden Butterfly Portfolio? Here's my honest take. (Keep in mind this is one person's opinion.)
This portfolio makes the most sense for:
- Investors within about 10 years of retirement, or already in retirement, who prioritize sequence risk management over maximizing long-run total returns.
- Risk-averse investors at any age who genuinely cannot stomach 30-50% drawdowns without selling, because a portfolio that loses 17% that you stick with is worth more than one that loses 50% and causes you bail at the bottom.
- Investors who find the traditional 60/40 insufficient diversification and want exposure to more economic environments.
This portfolio is probably not ideal for:
- Accumulators in their 20s-30s with a high risk tolerance and a long time horizon. You're arguably trading too much long-term return for smoothness you don't yet need.
- Investors who are genuinely indifferent to volatility and have the behavioral discipline to ride out 40%+ drawdowns. They'd likely do better with more stocks.
- Anyone whose primary goal is maximizing terminal wealth over 30+ years.
- Investors only using a taxable brokerage account. Tax drag is real. More on this in a sec.
If you fall into the first group, the Golden Butterfly is worth serious consideration. If you're in the second, you're probably leaving money on the table over the long run. The leveraged version at the bottom of this post attempts to address that latter group specifically, albeit unsuitable for unsophisticated investors.
It's also entirely possible that you think you're in the second group when your true risk tolerance really puts you in the first group. Many severely overestimate their emotional fortitude in the face of market turmoil.
Tax Efficiency and Account Placement
Something that seems to get glossed over in discussions of the Golden Butterfly Portfolio is the fact that it's pretty tax-inefficient.
Gold ETFs are taxed by the IRS as collectibles, with a maximum long-term federal capital gains rate of 28%, versus a max of 20% for standard equity ETFs. That 8-percentage-point gap adds up fast.
On a $50,000 gain from a gold position, you're looking at $4,000 in extra federal taxes in a taxable account compared to an equivalent equity gain. After years of gold compounding at 20%+ annually, investors holding gold in taxable accounts may be sitting on large embedded gains with an unpleasant surprise attached.
Then we've got 40% in bonds, and bond interest is taxed as ordinary income, not as capital gains. That means you're looking at up to a 37% tax bill on the bonds allocation.
Then there's the 20% in small cap value stocks. The small cap value segment invariably involves more trading and more distributions than a broad market index fund, so it's usually best to shelter these too.
The most tax-efficient component – a total stock market index fund – is only 20% of the portfolio.
If you're investing entirely within tax-advantaged accounts, none of this matters. If you have a mix, prioritize getting gold out of your taxable account first. The others are comparatively manageable.
Golden Butterfly Portfolio ETFs for M1 Finance
M1 Finance is a great choice of broker for U.S. investors to implement the Golden Butterfly Portfolio because it makes regular rebalancing seamless and easy, and it has zero transaction fees. I wrote a comprehensive review of M1 Finance here.
Utilizing mostly low-cost Vanguard funds, we can construct the Golden Butterfly Portfolio pie with the following ETF's:
- VTI – 20%
- VIOV – 20%
- VGLT – 20%
- VGSH – 20%
- SGOL – 20%
You can add this pie to your portfolio on M1 Finance by clicking this link and then clicking “Add to Portfolio.”
Canadians can find the above ETFs on Questrade or Interactive Brokers. Investors outside North America can use Interactive Brokers.
Taking the Golden Butterfly Portfolio International
You may have noticed a glaring problem with the Golden Butterfly Portfolio: it only uses U.S. assets and has no international exposure. That's almost certainly suboptimal, especially considering its whole purpose is to reduce volatility and risk. Taking the stocks global, the portfolio and subsequent pie then look like this:
- VT (world stock market) – 20%
- VIOV (US small cap value) – 10%
- AVDV (int'l small cap value) – 10%
- VGLT – 20%
- VGSH – 20%
- SGOL – 20%
You can add this pie to your portfolio on M1 Finance by clicking this link and then clicking “Add to Portfolio.”
Canadians can find the above ETFs on Questrade or Interactive Brokers. Investors outside North America can use Interactive Brokers.
Modified Golden Butterfly Portfolio
A “Modified Golden Butterfly Portfolio” emerged on the Bogleheads forum in mid-2017. Of course, anyone can create their own “modified” version of any portfolio. The one proposed combines my above suggestion of diversifying internationally with equities and avoiding gold, choosing instead to use TIPS and REITs as direct inflation hedges:
- 20% Total World Stock Market
- 20% Total World Small Cap Value
- 20% Long-Term Bonds
- 20% Short-Term Bonds
- 10% TIPS
- 10% REITs
Using mostly low-cost Vanguard funds, we can construct this Modified Golden Butterfly Portfolio as follows. At the time of writing, since there's no ETF available for global small cap value, I'm using half U.S. small cap value and half international small-cap value.
- VT – 20%
- VIOV – 10%
- AVDV – 10%
- VGLT – 20%
- VGSH – 20%
- SCHP – 10%
- VNQ – 10%
You can add this pie to your portfolio on M1 Finance by clicking this link and then clicking “Add to Portfolio.”
Canadians can find the above ETFs on Questrade or Interactive Brokers. Investors outside North America can use Interactive Brokers.
Leveraged Golden Butterfly Portfolio
We can't construct a leveraged Golden Butterfly Portfolio that matches the base portfolio perfectly because there are no leveraged ETFs available for short-term bonds or small-cap value stocks. However, holding 20% long-term bonds and 20% short-term bonds is roughly the same thing as holding 40% intermediate-term bonds. We can also combine the 2 20% stocks positions to a single 40% position to track the S&P 500.
The next issue is that there are now no 3x gold ETFs available. Using 3x leverage on intermediate-term treasury bonds and 3x leverage on the S&P 500 for stocks, we can roughly match the intended exposure ratio with the following allocations:
36% 3x stocks
36% 3x interm. treasury bonds
28% 2x gold
This leveraged Golden Butterfly Portfolio essentially becomes a variant of Hedgefundie's Excellent Adventure with a heavy allocation to gold.
Remember that using leverage – especially in the form of leveraged ETFs – increases portfolio risk and the potential for greater returns, but also the potential for greater losses. Do your own due diligence before blindly buying leveraged funds, and read the fine print on these products. They can potentially be extremely dangerous. I talked a bit more about leveraged ETFs and how they work here.
Below is a backtest showing how this portfolio would have performed vs. the S&P 500 and a 60/40 portfolio historically:
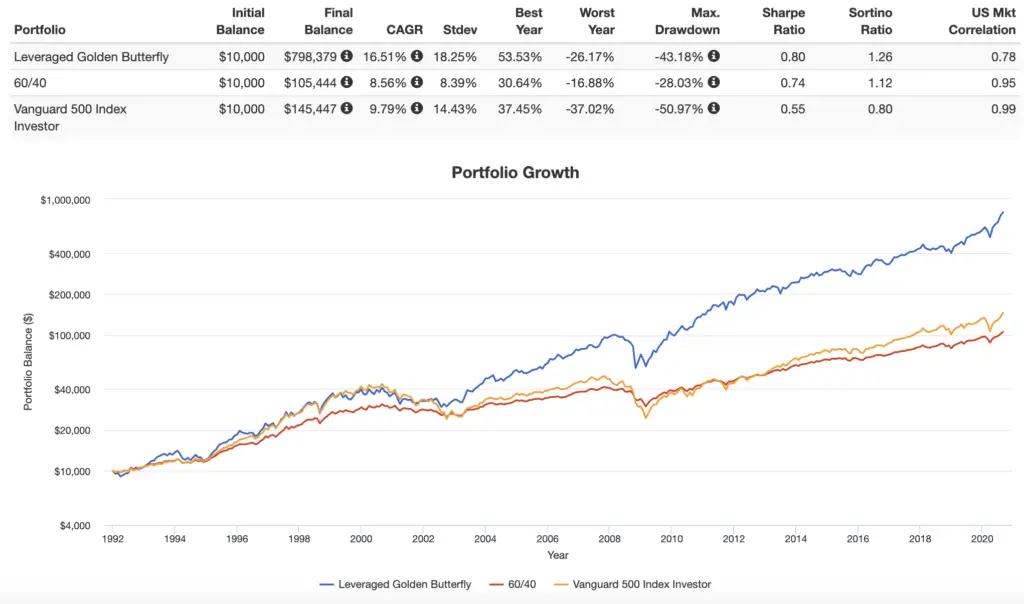
Notice this portfolio would have achieved much higher returns historically with volatility not too much greater than an S&P 500 index fund, and with smaller drawdowns. This portfolio even achieved a greater risk-adjusted return than a classic 60/40 portfolio.
Using popular leveraged ETFs from ProShares and Direxion, we can construct this leveraged Golden Butterfly Portfolio as follows:
UPRO – 36%
TYD – 36%
UGL – 28%
You can add this pie to your portfolio on M1 Finance by clicking this link and then clicking “Add to Portfolio.”
Right now M1 is offering a promotion of a 1.66% discount on their base margin rate for 12 months, taking it from 5.65% down to 3.99%. Just opt in by 1/31/26 using the link below to lock in your reduced rate for the year ahead, whether you want to borrow now or later.
Are you nearing or in retirement? Use my link here to get a free holistic financial plan and to take advantage of 25% exclusive savings on financial planning and wealth management services from fiduciary advisors at Retirable to manage your savings, spend smarter, and navigate key decisions.

Disclosures: I am long VTI and UPRO in my own portfolio.
Interested in more Lazy Portfolios? See the full list here.
Disclaimer: While I love diving into investing-related data and playing around with backtests, this is not financial advice, investing advice, or tax advice. The information on this website is for informational, educational, and entertainment purposes only. Investment products discussed (ETFs, mutual funds, etc.) are for illustrative purposes only. It is not a research report. It is not a recommendation to buy, sell, or otherwise transact in any of the products mentioned. I always attempt to ensure the accuracy of information presented but that accuracy cannot be guaranteed. Do your own due diligence. I mention M1 Finance a lot around here. M1 does not provide investment advice, and this is not an offer or solicitation of an offer, or advice to buy or sell any security, and you are encouraged to consult your personal investment, legal, and tax advisors. Hypothetical examples used, such as historical backtests, do not reflect any specific investments, are for illustrative purposes only, and should not be considered an offer to buy or sell any products. All investing involves risk, including the risk of losing the money you invest. Past performance does not guarantee future results. Opinions are my own and do not represent those of other parties mentioned. Read my lengthier disclaimer here.

Are you nearing or in retirement? Use my link here to get a free holistic financial plan and to take advantage of 25% exclusive savings on financial planning and wealth management services from fiduciary advisors at Retirable to manage your savings, spend smarter, and navigate key decisions.

It seems like LTPZ serves as an interesting option that offers lower standard deviation and CAN outperform the UGL portfolio over some time horizons while underperforming over others where gold spiked. At the same time, LTPZ seems like a more ‘natural’ hedge for such a levered portfolio. Thinking that more ‘natural’ hedge that uses the duration risk rather than direct leverage exposure in an already levered portfolio is more conservative on the downside while allowing much of the same upside. Thoughts?
I’ve been messing with Backtest Portfolio and the leveraged utilities / financial All Weather numbers. This was pretty darn good.
UPRO 30
UBT 40
TYD 15
UTSL 7.5
FAS 7.5
But then I was comparing Golden Butterfly and ended up at a “reversed” AW (or modified Perm?). Only -0.4% CAGR but better volatility, Drawdown, and Sharpe. Would that still be the case further back in time, say through 2008 or DotCom?
UPRO 30
*UBT 15*
*TYD 40*
UTSL 7.5
FAS 7.5
How can I check this stuff further back in time? It tells me UTSL is the limiting factor, UPW (2x) got me back to 2010, TMF back to July 09, SPXL to May 09…
And thank you for your quick response to my other post.
UBT is 2x while the others are 3x. I think you meant to use TMF.
Yea, 10 years doesn’t tell us too much, especially since we’ve been in a bull market basically the whole time.
You can create your own simulation data from the underlying index and upload to PV (this might only be on the paid version now) or for a quick and dirty method, use the ‘normal’ 1x funds and a negative cash position to simulate borrowing.
I came across the Golden Butterfly portfolio a few years ago while doing research for a portfolio that would provide a high Safe Withdrawal Rate during retirement – at the time, the SWR for the GB portfolio was around 6.5% over 30 years. Although you touched upon it’s value of providing a portfolio to minimize volatility and risk in retirement, I’m surprised that you started swapping some of the core assets out to maximize performance (to the point of using leveraged funds, which is counter to why people use this fund in the first place).
People are free to use whatever version of whatever portfolio they want based on their own goals, time horizon, risk tolerance, and beliefs about certain assets. “Swapping” some assets wasn’t an attempt at chasing performance; those versions would likely have lower volatility and risk than the original. Global stocks is a no-brainer.
Here’s a question that’s I’m having a hard time finding an answer to. Dues having short term bonds in the golden actually make any sense? Replacing shot term Treasurys with more long term increase returns and barely effect draw downs on PV (about 1% different in 08.) Is the short term T for times like the 70s with high inflation as the short term rates will quickly rise or are they just pointless?
For the GBP’s intended purpose of doing well in any environment for basically any horizon, yes, in that short bonds are a decent inflation hedge. But for a long term investor, not really, in my opinion. The portfolio takes a bond barbell approach – half long, half short, which basically equals an intermediate duration position. Keep in mind what happened in the past may not happen in the future.
I’d be interested to hear your thoughts on using VBR for small cap value, given your recent small value showdown https://www.optimizedportfolio.com/small-value-showdown/. .i.e. why VBR here vs VIOV or AVUV?
Just haven’t swapped it out for this portfolio yet. Will hopefully get to it soon.
Hi John,
Thank you for this excellent post.
I have a practical question. I would like to back test your leveraged golden butterfly portfolio, but in PortfolioVisualizer UPRO, TYD (and possibly UGL) go back only about 10 years. For UPRO I found a simulation file in the HedgeFundy discussion. Do you have a similar solution for the others as well?
Kind regards,
Wouter
You could create simulated returns for those, or for a quick and dirty way, just use mutual fund equivalents of the underlying and set them at 200% or 300% with a negative CASHX position in PV to simulate borrowing.
Curious as to your choice of TIP for your modified GB portfolio, versus VTIP, SCHP, or LTPZ? Does TIP have a longer average maturity then others, providing better protection (within this overall allocation setup)?
Great question. VTIP is short. LTPZ is long. TIP and SCHP are intermediate, so SCHP would be a suitable replacement. I’ll probably make that swap when I have time. LTPZ would likely be a fine choice too if one has a long investing horizon. I may look into which one backtests better and will come back and update you.
Did some backtesting. As we’d probably expect, the one with LTPZ has delivered slightly greater returns, with slightly more volatility. Identical risk-adjusted returns as measured by Sharpe.
Have you ever thought about a leveraged version of the Golden Butterfly portfolio ?
I did some backtest on PV and it looks amazing,both x2 and x3 versions.
Hi Jeremy. I explored a leveraged option above here.
Yeah,my bad I didn’ see that for error
Which one has the best chance to perform with higher sharpe ratio,cagr and lower drawdown and standard deviation,if you had to bet on it:
Hedgefundie or Leveraged Golden Butterfly ?
Tough to say. I’d bet the leveraged Golden Butterfly would have lower volatility and smaller drawdowns but it would probably sacrifice some return with the gold. Hedgefundie would likely have a higher CAGR with more volatility, but long term bonds are also starting to look potentially questionable. I’d imagine the risk-adjusted returns as Sharpe would be extremely close.