QYLD has been gaining popularity among income investors as a bullish-yet-defensive play on the NASDAQ 100. Here we'll review it and look at why it's probably not a great choice for a long-term buy-and-hold portfolio.
Disclosure: Some of the links on this page are referral links. At no additional cost to you, if you choose to make a purchase or sign up for a service after clicking through those links, I may receive a small commission. This allows me to continue producing high-quality content on this site and pays for the occasional cup of coffee. I have first-hand experience with every product or service I recommend, and I recommend them because I genuinely believe they are useful, not because of the commission I may get. Read more here.
Contents
Video
Prefer video? Watch it here:

Introduction – What Is QYLD and How Does It Work?
QYLD is an ETF from Global X that holds the NASDAQ 100 index and also sells covered calls on it to generate income. To my knowledge, it is the largest covered call strategy fund with over $3 billion in assets.
As a brief refresher, covered call writers own the underlying and collect a premium on the option, and the buyer of the call option has the right to buy the underlying at the strike price at or before expiration. For example, if I own a fund like QQQ for the NASDAQ 100 and I think it's going to be relatively flat for the next 30 days or so, I might sell a call option on it, for which I receive cash immediately (called the premium). The buyer of that call option is hoping QQQ goes up. As the seller, I'm hoping it stays flat. Call options are usually sold to generate income in a flat or mild bear market.
This is exactly what QYLD does. The fund holds stocks in the NASDAQ 100 and writes 1-month at-the-money calls on them. It's pretty simple; nothing proprietary going on. QYLD charges a fairly hefty 0.60% for this strategy. QYLD is popular because this allows the fund to have a distribution yield upwards of 10% that pays monthly, making it attractive to income investors.
Is QYLD a Good Investment?
So is QYLD a good investment? Probably not.
While QYLD uses the NASDAQ 100, Global X also offers RYLD for the Russell 2000 (U.S. small- and mid-caps) and XYLD for the S&P 500 (U.S. large caps). All 3 funds work the same way.
These funds seem to be popular among income investors and FIRE folks, but I have yet to see a compelling reason for investors' fascination with these funds. I have to assume most simply aren't looking past the extremely high yield and perhaps don't know what they're buying. There's even an entire community on Reddit dedicated to this thing.
Inexperienced investors seem to have this idea that the “income” and dividends from these expensive funds are free money, or that selling shares of a low-cost index fund like VTI – or even QQQ in this case – to realize gains of an equal amount is somehow inferior to receiving a dividend. Neither of these things is true. This irrational preference of dividends as income is just a well-documented – and admittedly understandable – mental accounting fallacy. Again, I suspect investors unfortunately aren't looking too far past the high yield carrot of these funds before buying in.
First, specific to QYLD, the NASDAQ 100 is poorly diversified and is basically a tech index at this point. It is purely large cap growth stocks. Investors have been chasing recent performance by flocking to NASDAQ 100 funds like QQQ and QQQM simply because the index has beaten the market over the past decade, thanks largely to Big Tech.
But the market itself is already over 1/4 tech, and large cap growth stocks are looking extremely expensive relative to history (and relative to Value). Moreover, the valuation spread between Value and Growth is as large as it's ever been. Because of all this, we've got concentration risk and lower future expected returns for large cap growth stocks. Only time will tell, but now may actually be the worst time to buy Growth and the best time to buy Value. Large value spreads have historically preceded its marked outperformance. Alas, all crystal balls are cloudy, but I'd argue that's precisely a good reason not to be concentrated in the NASDAQ 100 Index.
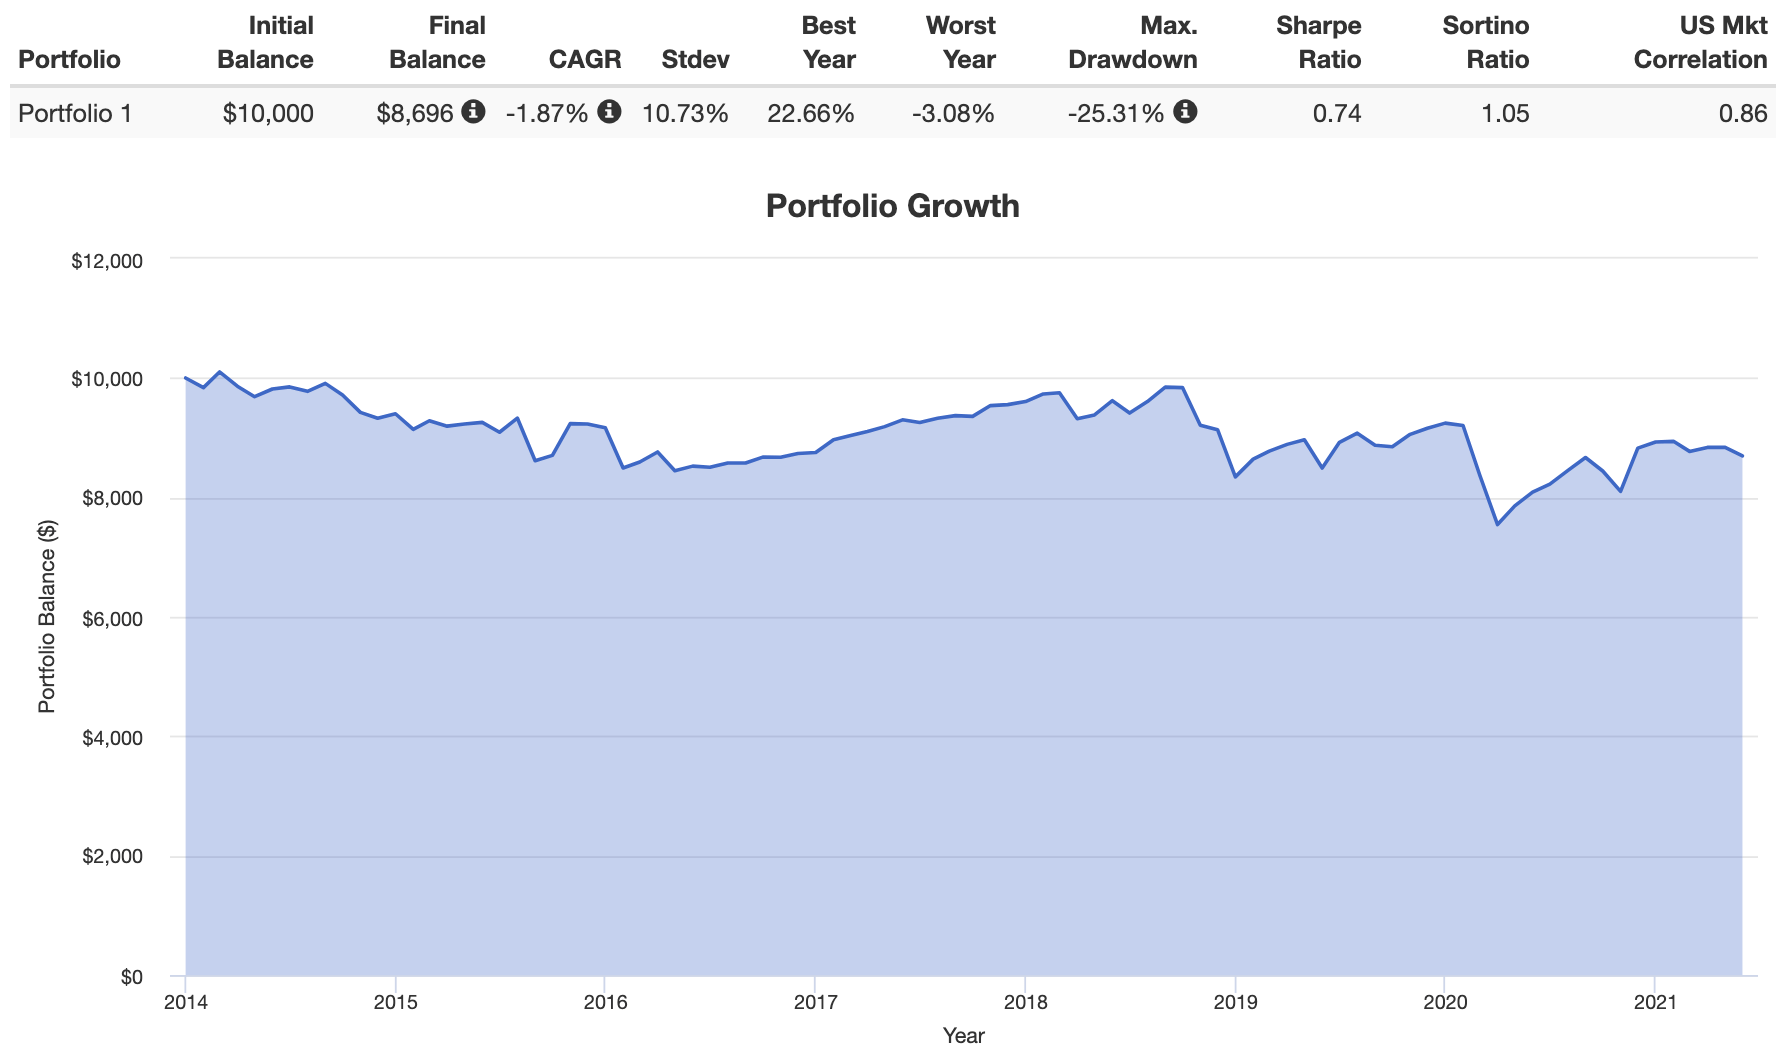
Secondly, dividends/distributions aren't free money. Because part of QYLD's assets come from its option selling, its total return is muted, making novice investors feel like it's safe. But this is the wrong way to think about it. Removing its distributions, QYLD's capital appreciation component is virtually flat on average and has actually been negative since inception:
QYLD vs. QQQ
At this point, since we're talking about dividends and price appreciation, let's pause the discussion for a second to look at QYLD vs. QQQ in terms of sheer performance. Recall that QQQ is just the plain ol' fund that tracks the NASDAQ 100 Index.
The backtest below will hopefully be eye-opening. Even with QYLD's dividends reinvested, the underlying QQQ has delivered a greater risk-adjusted (and general) return since QYLD's inception in late 2013:
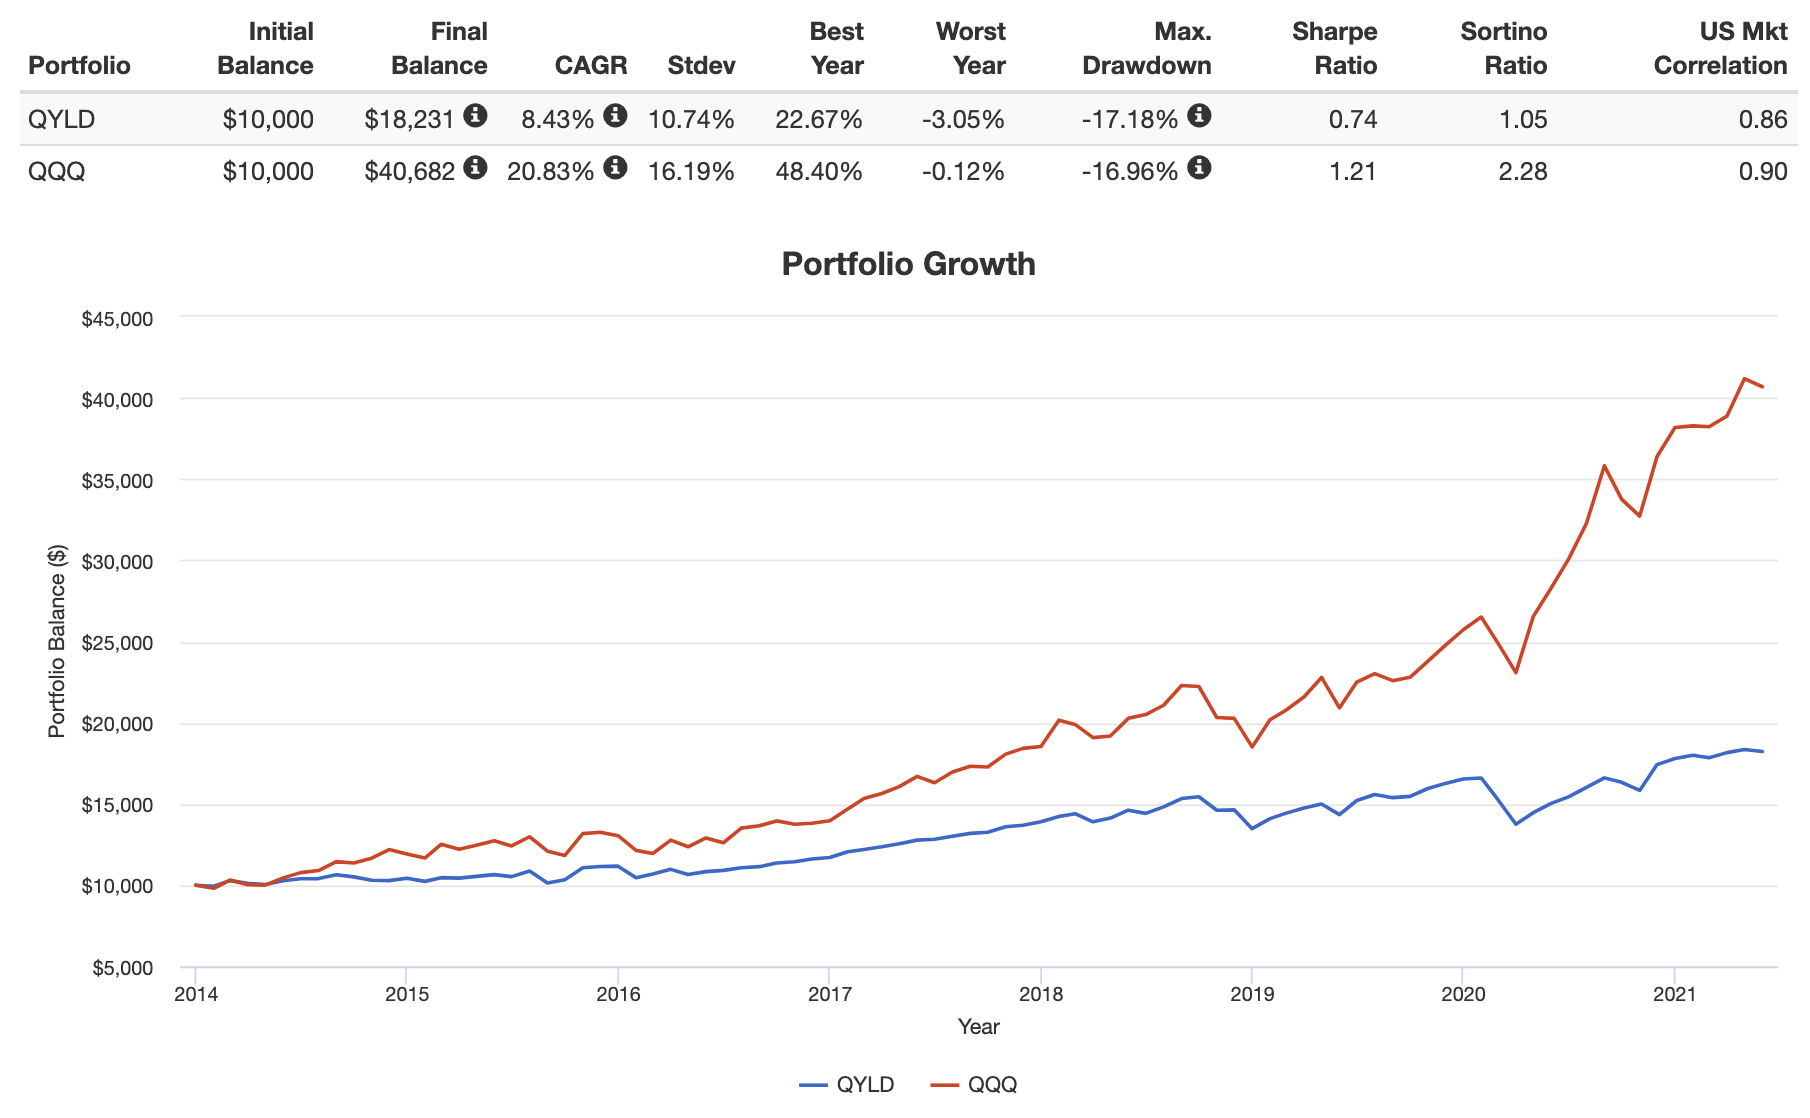
Some quick important takeaways:
- QQQ still delivered a significantly greater risk-adjusted return (Sharpe; ratio of return to volatility) even though it was about 50% more volatile than QYLD. Covered call strategists boast about their greater Sharpe ratios, but the argument doesn't even hold water here against the underlying QQQ. The Sortino ratio arguably illustrates this even better, as it only looks at downside risk. QQQ's Sortino ratio was over twice that of QYLD.
- More importantly, notice the nearly identical max drawdowns. Simply put, QYLD does not protect the downside. I'll explain this in a second. QQQ had a Calmar ratio (ratio of return to max drawdown) of over 3x that of QYLD as well.
- Similarly, QYLD doesn't get to fully participate in the upside. Notice how the “best year” return for QQQ was more than double that of QYLD. I'll explain this later, too.
I usually say backtests don't mean much (i.e. they have little to no bearing on the future), but out of all the ones I've posted on this website, this one is arguably the most telling, the most straightforward, and the most useful for one's future strategy. If it doesn't illustrate why this fund is pretty awful, I don't know what will. What's more, all this poor performance of QYLD comes at 4x the price of its underlying index.
I'll resume the discussion and continue explaining the details in the following section.
Continuing the Discussion – More Reasons QYLD Stinks
I can easily think of 2 other portfolios off the top of my head that are safer, cheaper, more diversified, more tax-efficient, and that have had much higher general and risk-adjusted returns, lower volatility, lower excess kurtosis, and smaller drawdowns than QYLD. If one wants a high dividend yield to use as income, I'd think you could think of combinations of dividend funds, high yield corporate bond funds, etc. that would be objectively superior to QYLD in almost every way, such as Portfolio 3 in the backtest I linked. You'd likely even come out ahead after taxes with high-div REITs considering QYLD's high fee. Moreover, its return has even severely lagged income-focused CEF's. I designed a dividend portfolio for income investors here that may appeal to you.
The situation for QYLD is exacerbated in a taxable environment because you're taxed on any taxable distributions, regardless of whether or not you reinvest them. Thankfully, some of QYLD's distributions may be classified as a return of capital, meaning no taxes (until your cost basis is zero), and most of them have indeed been ROC in recent years for QYLD, but this hasn't always been the case during the fund's lifespan, so that preferable tax treatment is by no means guaranteed. Look at 2016, when the fund's ROC was only about 27% and short-term capital gains distributions were about 51%. This was also a wake-up call for many in early 2022, when Global X announced that 100% of QYLD's distributions for 2021 would be classified as – and thus taxed as – ordinary income, not as ROC. Ouch.
I'm a fan of simply selling shares as needed for any “income” needed, which should be mathematically preferable anyway if you don't actually need that income on a monthly basis, as it allows you to leave more money in the market longer.
Thirdly, covered calls cap the upside at the strike price. They're not a free lunch. If the underlying rallies, you don't get to fully participate. Aren't we investing in the market – in any form – because we expect it to go up more than it goes down? Even if income is the goal, why would we want to purposefully stifle the portfolio's growth? This concept is illustrated in the backtest above by the “best year” returns.
In total fairness to QYLD, a covered call fund would be nice in a totally flat market, as you'd just float along collecting the premium from writing call options when the underlying isn't doing anything. Granted, the premium would be lower, but you'd be better off than if you were only holding the underlying index that was just moseying along decaying. But we don't see that market environment very often (and we wouldn't expect to), and for the rest of the time leading up to and following that flat period, you'd be underperforming. This type of flat market is even less likely with the Nasdaq-100, which is actually good in terms of the premium received.
Lastly and arguably most importantly, covered calls don't protect the downside. This is probably the one I see QYLD proponents erroneously trying to push most often. In fairness, they simply may not understand how covered calls work. Don't succumb to mental accounting bias; the premium received doesn't mean much if the market crashes. If the underlying drops, so does the fund, along with its distribution yield. Again, you don't have to take my word for it; just look at the clear illustration in the backtest above of the nearly identical drawdowns. Another covered call fund, NUSI, does offer downside protection by buying a protective put option.
I see comments all the time about QYLD being “safe” or that it offers “downside protection.” Neither of these things is true. Global X themselves even claim in the fund literature that “covered call strategies can play a useful role in a portfolio during downturns,” but they sort of gloss over the fact that the drawdowns are typically lower by the precise amount of the option premium received; that cash doesn't really offer any “protection.” Returns from covered call funds like this are asymmetrical, and we would expect them to be – severely capped upside, but nearly the same downside as the underlying index. In statistical terms, this is called negative skewness of returns, and investors typically try to avoid it.
So we're purposefully limiting the upside potential while leaving unlimited downside risk, all in the name of “income.” Intuitively, this should at least strike you as suboptimal.
I personally don't think QYLD's 12% yield is sustainable anyway. So far the fund hasn't had to endure a major crash like 2008 or 2000, or arguably worse, a protracted bear market. Market conditions (a raging bull market for the most part, particularly for Big Tech) have been ideal for these funds in their relatively short lifespans thus far.
In terms of downside protection, there's an objectively better, simpler, cheaper, more tax-efficient solution that existed long before these funds came about: decrease stocks and add bonds. And for those who are holding QYLD because they think bonds suck, consider checking out my brief rant on why bonds are still useful in basically any environment. We'd also want to be more diversified across assets and geographies in general. In short, as the backtest above showed, covered calls are not an efficient way to lower the volatility and drawdowns of a portfolio.
And again, all these undesirable characteristics come at 4x the price of the underlying index.
Suppose you still hate bonds. You can use T-bills, which are literally called the “risk-free asset” and are considered a cash equivalent. They also happen to be a decent inflation hedge because they can be rolled quickly. Let's take the simplest example of a naively-weighted 50% NASDAQ-100 and 50% cash (T-bills) to once again show how one can easily beat QYLD in a simpler, cheaper, more tax-efficient manner:
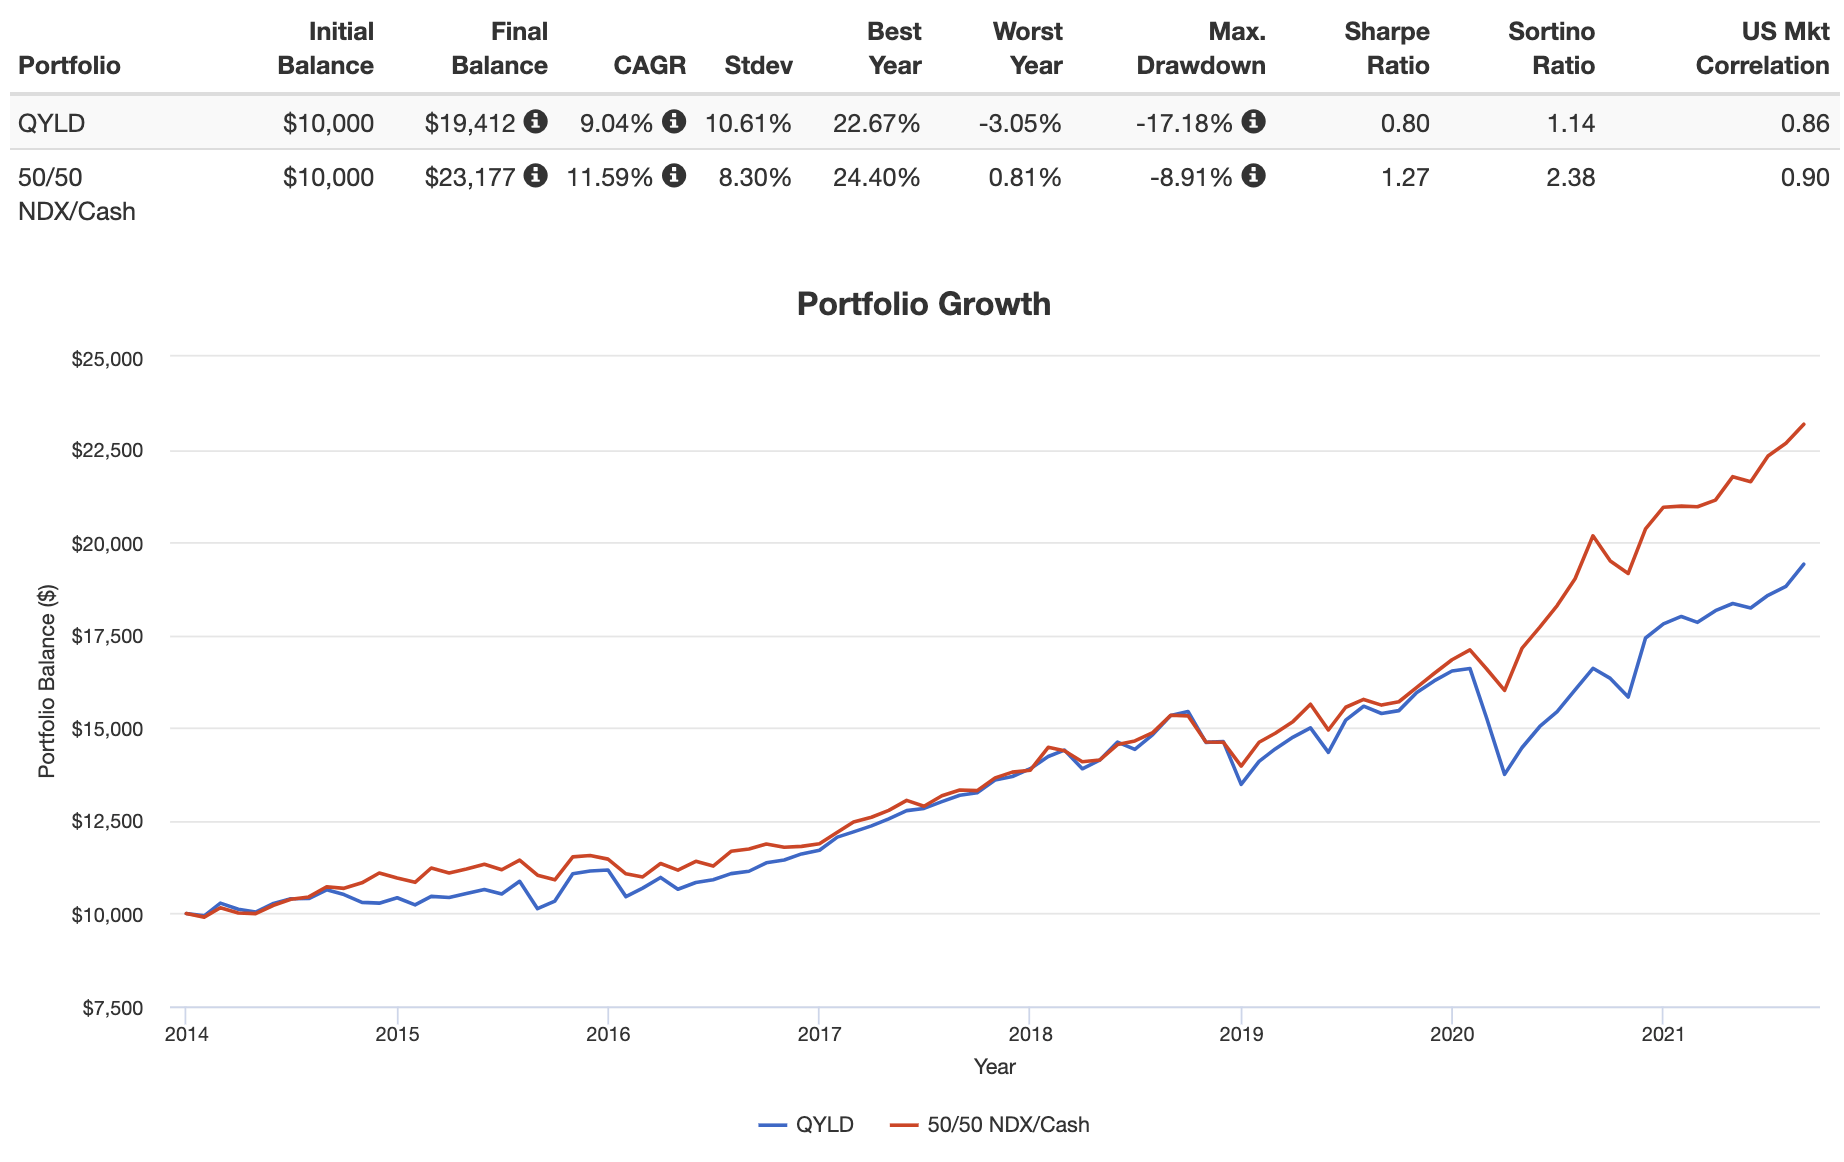
Notice how we've once again beaten QYLD on every single metric – higher return, lower volatility, more upside captured (best year), lower volatility, much smaller drawdown, and much higher risk-adjusted return.
I've created that pie for M1 Finance here if you're interested. I wrote a comprehensive review of M1 and why it's great for income investors here.
Canadians can find the above ETFs on Questrade or Interactive Brokers. Investors outside North America can use Interactive Brokers.
Conclusion
The only appropriate scenario I can see for buying these types of funds is if the investor, for some reason, consciously wants to implement a rolling covered call strategy without handling the logistics of writing the options themselves, in order to generate regular income (from the option writing) that they need every month. Let me put this very simply and straightforwardly. If you do not need that regular income every single month to pay for your expenses, there is no reason for you to buy funds like these. More generally, I'd even say if you are reinvesting its dividends, there is no reason for you to buy funds like these.
But if income is the concern, I'd say just go with CEF's, or again, a combination of dividend stocks and high-yield bonds. “Income” is overrated anyway. I'd be more likely to go with something like SWAN or SPD and just set up an automatic monthly transfer from the brokerage account that sells shares for me; there's my “income.” In the interest of full disclosure, I'm not a dividend investor anyway, and I'd rather just sell shares as needed, so these types of yield-focused strategies don't appeal to me regardless. I'd rather create my own dividend when I want to. But after looking at the objective facts, I still can't understand why anyone would buy these funds.
Again, we can construct a demonstrably superior strategy with even the simplest, naive mix of 50% NASDAQ-100 and 50% T-bills. I've created that pie for M1 Finance here if you're interested. I wrote a comprehensive review of M1 and why it's great for income investors here.
Ironically, if I were forced to use these funds, I'd certainly go with the greater diversification of XYLD with a dash of RYLD to get exposure to the entire U.S. market instead of the more popular QYLD that narrows in on the NASDAQ 100. Investors have gravitated toward the latter due to recency bias and performance chasing. This is both irrational and hypocritical, as they're simultaneously citing QYLD's “safety” and “protection.” One will inarguably get comparatively more of those things with the broader index that XYLD uses (the S&P 500). Some are buying QYLD on margin, which doesn't make much sense to me. Others are even using QYLD as a savings account “replacement” and are reinvesting the dividends, which is nonsensical.
There's no free lunch outside of diversification. If you are reducing risk with expensive option hedging strategies, you are by definition also accepting lower expected returns. But as we've seen, QYLD doesn't even do a good job of that. Again, covered calls are simply not an efficient way to de-risk a portfolio.
In fairness, with bonds entering a headwind and stock valuations at all time highs, options strategies may indeed prove fruitful going forward for some unknown time period for the income investor with a short time horizon; but I'd still submit that it's highly unlikely we'd see a flat market over the long term, and I'd still prefer something with downside protection like NUSI. Only time will tell. Covered call funds are also not the worst strategy I've seen to try to generate income.
Do you own any of these income-focused option strategy ETFs like QYLD, RYLD, XYLD, JEPI, HNDL, NUSI, DIVO, etc.? Let me know in the comments.
QYLD FAQ's
Lastly, here are some frequently asked questions about QYLD.
When does QYLD pay dividends?
QYLD pays dividends monthly.
When was QYLD started?
QYLD launched on December 12, 2013.
How does QYLD make money?
QYLD makes money by writing covered call options on the NASDAQ 100 index, thereby collecting premiums for those options contracts.
Are QYLD dividends qualified?
No, dividends from QYLD are not qualified.
What does QYLD invest in?
QYLD holds stocks in the NASDAQ 100 index and writes covered calls on them to generate income.
Can QYLD crash?
Yes, QYLD can crash, and it has already in the past.
Can QYLD go to zero?
Asking if QYLD can go to zero is sort of like asking if the stock market can go to zero, as it can rise and fall with its underlying equities holdings. It is unlikely, but remember that QYLD's capital appreciation component (irrespective of its options income) has already been negative since inception.
Why is QYLD bad?
QYLD may not be suitable for long-term investors who don't need to supplement their current income, as its total return is muted by its option writing and it also carries a relatively hefty fee.
Why is QYLD going down?
QYLD can go down with the underlying NASDAQ 100 index. Writing covered call options does not make QYLD immune from market downturns.
Who owns QYLD?
QYLD is a covered call fund from Global X.
How does QYLD work?
QYLD holds stocks in the NASDAQ 100 index and writes covered calls on them to generate income and subsequently pay a high distribution yield monthly.
Are you nearing or in retirement? Use my link here to get a free holistic financial plan and to take advantage of 25% exclusive savings on financial planning and wealth management services from fiduciary advisors at Retirable to manage your savings, spend smarter, and navigate key decisions.

Disclaimer: While I love diving into investing-related data and playing around with backtests, this is not financial advice, investing advice, or tax advice. The information on this website is for informational, educational, and entertainment purposes only. Investment products discussed (ETFs, mutual funds, etc.) are for illustrative purposes only. It is not a research report. It is not a recommendation to buy, sell, or otherwise transact in any of the products mentioned. I always attempt to ensure the accuracy of information presented but that accuracy cannot be guaranteed. Do your own due diligence. I mention M1 Finance a lot around here. M1 does not provide investment advice, and this is not an offer or solicitation of an offer, or advice to buy or sell any security, and you are encouraged to consult your personal investment, legal, and tax advisors. Hypothetical examples used, such as historical backtests, do not reflect any specific investments, are for illustrative purposes only, and should not be considered an offer to buy or sell any products. All investing involves risk, including the risk of losing the money you invest. Past performance does not guarantee future results. Opinions are my own and do not represent those of other parties mentioned. Read my lengthier disclaimer here.
Are you nearing or in retirement? Use my link here to get a free holistic financial plan and to take advantage of 25% exclusive savings on financial planning and wealth management services from fiduciary advisors at Retirable to manage your savings, spend smarter, and navigate key decisions.


Hello,
I think you all fail to understand one thing here. The US population is getting older, and so there will be more people withdrawing money from the market than depositing. What does this mean? This means the US market is aging and will eventually become like it’s European counterpart. This means that in due time, the US market will remain mostly flat…even tough other investors from around the world are still throwing money at the US market. WHEN this happens, try holding QQQ rather than QYLD. Considering only dividends to the exclusion of capital, QYLD does not care whether the market is going up or down as you will still get something at the end of the month. Buy QQQ at the top and have 10 years of a flat index, compared with the same thing but with QYLD.
Option strategies that are net short theta benefit from the known but persistent premium of implied volatility over realized volatility. That is genuine additional alpha, at least in theory. It is small but, as Josh points out above, the kind of stock returns we saw in the last decade aren’t likely to occur again for a few years.
Can anyone explain this:
On 2/17/20 before COVID QYLD was $23.74 QQQ $230.27 (about 10%)
On 3/16/20 bottom QYLD was $18.23 QQQ $170.70 (also about 10%)
On 5/27/22 NOW QYLD is $18 QQQ $308 (roughly 6%)
Is QQQ overpriced or QYLD underpriced?
I purchase qyld through my Roth account and it has done me wonders!
Dividends provide a semi-guarentee return to a business’s profits. Price appreciation of stocks is not guaranteed, is speculative at best, and entirely depends on what the market does. Price appreciation all depends on someone else buying at a particular price.
Both have thier place, but Dividends have thier place as a return of business income. You can have the best company in the world but it might not appreciate of the market doesn’t see it like that.
Unfortunately nothing in investing is guaranteed. The investor can also “semi-guarantee” a piece of a business’s profits by selling shares as well. Agreed that dividends have their place; I tilt Value, so I own many dividend-paying stocks.
Thank you for this information. I am currently invested in qyld and have been doing well so I thought. With this info I will reconsider and rebalance my portfolio. I am looking for a monthly income for our household expenses. One which will grow as inflation rises.
Sorry for the basic question, but I am not understanding the math. We know that the S&P is supposed to return an average of 7%-10% per year. Excluding the COVID stimulus stock bonanza we experienced, if you have a dividend yield of ~12% and you reinvest this dividend back into the fund, how is it that the indicies are outperforming this strategy?
First, the S&P has returned that historically; we don’t know what it will do in the future. To answer your question, as I noted, total return is what matters. Dividend yield is just one component of that, and is simply the percentage of the annual dividend/distribution relative to the fund’s share price, which fluctuates.
John, I was considering investing in one or even two of these covered call etfs… NOT as an alternative to investing in the non cc etfs (SPY, QQQ, etc), but as an alternative to leaving money uninvested during turbulent times. I hate being uninvested normally. And normally am far more weighted in growth stocks than value. But I pulled out a chunk just before things went sideways and it’s sitting there in cash, in effect depreciating due to inflation. I was thinking investing in these funds for the short term at least yields something (if not growth). Obviously, I may miss a rally but I have the vast majority in everything else, so I’m only talking like 2-3% of the total portfolio (at most). I am planning to do this in a Roth IRA so no tax effect.
Would max out I Bonds first if you can. Covered call funds are nothing like a savings account and aren’t really made for “turbulent times.” All else equal, inflation hurts stocks over the short term. You might want to look into specific inflation hedge assets; I explored some here.
I am glad I read this because I thought QYLD provided some downside protection and I tested it by splitting my QQQ into QQQ and QLYD on the first of the year 2022. I was ready to move it all to QYLD because from year to date my QQQ is down about 12% and my QYLD is only down about 7% and I received two 1% distributions so far.. I will monitor this more closely to see when it is not working.
I’m not really understanding so please correct me if you can figure out where I’m off. The non covered call funds are more profitable because:
1. QYLD fees being more expensive reduces my profit.
2. QYLD growth, dividends, and covered call thingies combined is still less than its non-covered call counterparts.
Regarding Collins’ question above, so what you’re saying is that selling X amount of non-covered call ETF shares combined with its dividends will leave you with a higher amount of money left in the fund than you would have in your QYLD fund after taking home the same amount of money in the QYLD dividends? For ex.
Beg of year balance: $300k. QYLD sends you $10k over the course of the year. End of year balance = $300k.
$300k QQQ sends you $2k in dividends and you sell 20 shares to equal $8k. End of year fund balance = $320k.
This is due to the fact that the QYLD fund itself does not really grow, but the QQQ does, yes?
I was curious if the QYLD averages out over the years to keep up with inflation? I don’t understand what to look at to determine that for myself.
Thank you for your time.
Your understanding is correct, Laura. Of course those are hypothetical numbers and we can’t know the future, but yes, your understanding is what I illustrated that has happened historically. Remember we can only say that that’s what happened in the past, as past performance does not necessarily indicate future behavior. Stocks do tend to be a good inflation hedge over the long term, but not over the short term. I talked about that idea here.
Hi John,
Thanks for your indepth analysis of QYLD which I hold…..I was horrified to get my Brokerage Statement and see this year (2021 tax year) the distributions are Dividends not the ROC which was distributed in 2020…..do you happen to know how Global X determines “how they’ll categorize” them in 2022? What about for RYLD, is that also Ord. Div or ROC for 2022?
Thanks for your help, I see the tax implications are huge if it’s Ord Div in my taxable account.
Rick
Good eye, Rick. Impossible to say why they ended up doing a completely 180 on the classification after originally estimating mostly ROC. Possibly different tax advice, some investors reaching a zero basis, and/or recent market behavior.
Hi John
Good read and very helpful. I am looking for steady revenue investment options as I have other funds dedicated for just growth and other revenue ( traditional stock dividends/ bonds/ treasuries / annuities etc) .
Here is my understanding after doing some research on investing in QYLD .
1) QYLD in the recent past has given more than 90 % of its dividend as ROC ( Return of capital). So you will not be taxed on the ROC part of the dividend until your cost basis goes down to zero.
2) So if you invested 10,000 dollars and you get 1,000 dividend every year as return of capital (ROC) – then your cost basis will go down to zero at the end of 10 years.
3) If you sold your QYLD stock at that time, 10 yrs from the investment date , and sold it for the same stock price you will get 10,000 back ( assuming no change in stock price ) . Then the entire 10,000 will be taxed as dividend income because your cost basis has gone down to zero.
4) Now if this investment was not in a tax deferred account , you started with investing 10,000 , got back
10,000 as ROC over 10 yrs, At the time of selling your stock you get 10,000 and pay dividend tax on it, say 20 % netting 8000 after the sale minus dividend tax.. Am I right to assume you will end up with 18,000 at the end of 10 yrs on an investment of 10,000. Am I understanding this correct? .
5) Once my 10,000 is returned as ROC and if I decide to keep my stock without selling how can a 10 % return be sustained if only 1-2 % is coming from option premium revenue and true stock dividend revenue ? Will the other 8-9 % dividend come from new investor investments – being distributed as ROC ? . I am not sure how else to think that they can sustain a 10 % return.
6) Also the cost basis for the entire ETF will go down to zero for all investors combined if they keep giving a 10 % return.and most of it going out as ROC.
Does my understanding make sense ?
Viddi Revan
ROC is not guaranteed. There were years for QYLD when ROC was <20%. After cost basis reaches zero, any distributions thereafter would be taxed as dividends, yes. You'd pay taxes on any non-ROC distributions and any realized cap gains. Not sure where you're getting the $8,000 figure from. Maybe consult a tax professional.
While I agree with most of it, I don’t and will never sell shares to fund my 4% FIRE lifestyle therefore I have two portfolios, one 75% VTI 25% IUSB and another with some money in RYLD just to pay for my expenses. This way I can minimize the sequence of return risk in my 10 initial FIRE years
A covered call fund does not somehow minimize sequence risk, if that’s what you were getting at.
A great article. I’m still trying to understand the tax implications of QYLD, which I only just discovered in the 4th quarter.
A strategy that I had been considering was to invest in QYLD (and RYLD) by buying a few shares each week and enabling DRIP to create a compounding effect. The idea being to have a passive revenue stream when I am ready to retire (I’m in my mid-40s now) in conjunction with an IRA, individual stocks, and other investments.
But, based on this article, it sounds like this isn’t a good approach.
QYLD and RYLD are within my weekly budget. ETFs such as QQQ and VYM, for example, are not. Is PFFD a better option over either QYLD or RYLD? Do you have any ETF recommendations that are within a small investor’s budget?
Thanks, Jeff. Intuitively one would think the high yield would make the compounding happen faster, but alas that is not the case. In fairness, QYLD and RYLD have been pretty darn tax efficient in recent years with mostly ROC distributions.
By “within my weekly budget,” do you mean in terms of share price? Do you have access to fractional shares? I’ve got some notes on preferred stock here. I don’t pay attention to share price so I don’t know any cheap ones off the top of my head.
So, what if someone needs to generate cash flow? You know, the whole point of the fund. For example, if someone has too much money in retirement accounts, and wants to slowly transfer the $ to a taxable account without liquidating? 1 million in a retirement account generating 100k a year in payout, with the 100k being used to pay a loan for 2 million that is being deployed into spy in a taxable account? You generate 2 mil of capital via the loan put into spy, which is paid for by the fund’s payout, and you are essentially cash flow neutral. If you had to sell shares to fund the loan, selling 10% of the retirement account every year, you are going to have a larger tax bill (traditional IRA taxed as income) vs, the ROC of the fund. I agree however, buy and hold SPY is going to outperform always. But there might be cases where these etfs almost make sense.
Or! If someone was rich in assets (lots of property and stocks) but low in cash flow and wanted to up cash flow to fund a new property. 3 mil into cc etfs, returning 200-300k in cash to pay a loan on up to 5-6 mil. I think at these levels the tax effeciency is better than having to liqudiate and pay cap gains or income tax on 200-300k stocks every year. I bet it still fails to be more optimal, however.
All your hypothetical scenarios imply that 100% ROC is guaranteed; it’s not. Look at earlier years before that past 3-4 for the fund.
Initial investment 10,000 in 2014 with dividend of about 1% per month reinvested still over doubled one’s initial investment by year 2022. After the 2020 market crash it took about a year to get back the losses. I’m not really seeing the big problem here. And yes I am familiar with how covered calls limit upside gain..
An investment in the S&P 500 over the same time period nearly tripled. And an investment in the underlying Nasdaq 100 over that time period more than quadrupled.
You compare the performance of QYLD to QQQ since the year 2013. Of course, covered calls will underperform in that time frame, it was one of the best bull markets in history. So it just doesn’t seem a fair comparison, that kind of bull run can’t be sustainable in the long term. QYLD is a compelling place to put money when the markets correct or go sideways. And isn’t even the worst investment in a bull market for those who are risk-averse and or want income.
QYLD has only existed since 2013. We’ll see what the future holds. As I noted several times, choosing QYLD has nothing to do with one’s risk tolerance – if the market crashes, it will crash with it – and “income” is mental accounting. No, it is not a “compelling place to put money when the markets correct;” treasury bonds are. I illustrated this as well using half QYLD and half T-bills.
Income is not “mental accounting” If you need it asap to fund ventures. All income from these funds is counted as ROC until you are “returned” the amount you put in. So if you have 2 mil in a taxable, and put it in QYLD for a year, you can get out 200k in tax-free $ to fund whatever you need. VS taking out 200k via selling your QQQ, and having to pay LTCG. That’s tens of thousands saved IF YOU NEED THE CASH ASAP. There are tons of scenarios for this fund. You aren’t using your imagination John :0
If you “need cash asap,” you probably shouldn’t be buying an equities fund…
John,
One key point not discussed is that I believe this fund helps provide a little more return certainty. The option buyers are willing to provide that for the upside each month. In my case 5 years out from retirement I am hoping this will provide a little less sequence risk in my portfolio. (My perspective likes this in an up market too!!!).
Couple of notes:
The funds only pay half of the premium up to 1% per month and the average premium for the past few years is about 2.3%.
I suspect the funds will always pay 10-12% OF CURRENT VALUE, not your cost. If the value goes in half, your dividend to cost will be 5-6%.
A correction does concern me in so much the fund might cap themselves out each month on the comeback. You can see a bit of that after March 2020. After a major correction I plan to liquidate and roll positions to index funds.
Thanks for the comment, Chuck. I would argue that “return certainty” can be achieved much more effectively and efficiently via broad diversification across assets, such as with an all-weather approach. I would submit that predictability and mitigation of sequence risk is best achieved by lowering the portfolio’s volatility and risk, not by selling covered calls to generate a high dividend.
Yes, dividend yield is a function of price, not of cost basis.
Hi John – This was a great read. But would you indulge me on a similar run of the numbers?
Would you do the same comparison theorizing of a down market? Basically, take what we’ve seen in growth over the last two years and reverse it. Just make Dec 2021 be Jan 2022, Nov 2021 would be Feb 2022, etc., for two years. Then who would then be the better choice?
Thanks in advance
I don’t see how that would be a useful exercise, but you’re free to do it on your own time.
An excellent article and food for thought. QYLD represents access to the options market for those of us who don’t want to spend the time and happy to pay a fee for the pros to take care of it. Personally I view the fund as similar to an investment property, the capital value will fluctuate but the income is steady but also fluctuates with maintenance costs. For my mind QYLD has a deserved place within a balanced portfolio.
There’s the rub, though. That “income” is not guaranteed to be “steady.” As I noted, one can create demonstrably steadier “income” by simply diversifying across assets and selling shares as needed, all while saving on fees in the process. The “options market” is simply predicated upon the underlying equities and fixed income markets; options are not a separate asset class and, despite their seeming allure and complexity, should not be viewed as a portfolio diversifier.
Hi John. Thanks for the insight and great article. There’s one thing I didn’t understand that I’m hoping you can answer. If I look at a graph of QYLD’s price dating back to 2014, it appears to have appreciated from about $12 to its current $22 per share price. But your portfolio growth chart shows it losing money without dividend reinvestment. What am I not getting?
Thanks, Luis! Can you link me what you’re looking at? Yahoo Finance is showing me $25 in 2014 to current $22. See if this link works for that chart.
Thanks John. Yes, the link works and I see that now. I used stockcharts.com and maybe there’s a data problem with QYLD. Here’s the link to what I was looking at.
Yours includes dividend reinvestment. You can toggle reinvestment on and off here.
Looking into QYLD for a Roth ira as I already have a 401k at my work.. I am 7 years away from retirement so Just thinking of this as additional income to use when I retire . The dividends would be in a lower tax bracket then.
I am not looking at growth stock just a dividend paying IRA since I do have a 401k already for growth.
I enjoyed your analysis of QYLD. It was interesting because I own SWAN, YYY and HNDL for the purpose of income and capital preservation. The investments I own have been providing me with steady income. All though, SWAN, which does not pay a high dividend, is doing well for capital appreciation. YYY, HNDL and now after reading about QYLD have similarities in their investment approach. These investments are definitely not typical as far as the standard approach of growth fund investments. As a result, that is why I like them. In a perfect world getting a guaranteed 5% ROI would be great. However, in this not so perfect world, for me, these investments seemed to be the right approach. I am going to consider CRF next.
Pete, your comments seem to indicate you’re focusing too much on dividends in my opinion. They don’t do anything.
Hi John,
Thanks for the reply. But, for November, I had nearly $14,000 in dividends. That is something. Thanks for your interesting presentations. I am always interested in other points of view. Best wishes. Have a great 2022.
Yes, that is a component of your total return, which is all that matters at the end of the day. Thanks for the kind words.
Wow, this article gives me a different perspective on this most popular retirement fund. I was just looking to put my parents savings into this for income but now having second thoughts. This is worth re-reading and perhaps looking into your alternative suggestions(index/t-bill mix, qqq, bonds). It is just a lot of work to figure the right mix and sell fractional shares for income.
When you compare the returns, did you add the monthly dividend for QYLD? For 10-12% yield, QYLD returned 200% of the initial investment.
Yes
You say for income you would rather just sell the shares you need. If you did that over time, without adding any new money, wouldn’t you end up with less shares at there next downturn? Less shares would then mean that each share you own would have to go up more in relation to a situation where you have a dividend paying investment where your share count stays even as you are using the divs as income. At the bottom of the next correction with more shares, each has to do less work to get you back to even. Maybe I’m looking at it wrong but I can’t get my head around the good of having less shares. Even If I don’t need the income at that moment, I can reinvest, increase my share count, increase my income, have more shares working for me. I’m 68, in the early part of my retirement, don’t need dividends right now but do reinvest what I receive. Don’t own any of the YLD’s but have looked seriously at NUSI, HNDL, and NTSX. Have a good percentage of PLSDX in an IRA. I can envision reinvesting the PSLDX distributions then selling the shares I need for income. Backtesting that you can withdraw at least 7% or even 7.5% per year and still grow your investment in terms of value and # of shares. That’s the “ideal” investment I like.
As I noted, number of shares is irrelevant; we’re concerned with the value thereof. If I have 2 shares worth $500k each or 500,000 shares worth $2 each – and if I’m able to sell fractional shares – then it doesn’t matter. Those are the same thing. Having more shares per se doesn’t magically make my portfolio last longer or give it more value to cover my expenses in retirement. This post may help you think about this more intuitively.
I am definitely going to need to reread this and some of your other articles several more times before fully grasping. Really appreciate the time it took.
What I don’t follow at this point is the adversity to individuals who wish to use these dividends as a source of income. For example, I personally invest around 15% of my income in growth funds both in my 401k and roth ira. However with any spare cash at the end of the month I would place that into my dividend account. With a 10% yield, it quickly is becoming similar to a part time job and allows me to save more of my income in pre tax situations HSA, 401k, charity, etc
Just wanted to get your thoughts and sorry if this is explained, as I said have to reread this article several more times
Basically because dividends don’t do anything. Nothing against them for actual income to cover expenses, but many people are, for example, buying QYLD in a taxable account and just reinvesting the distributions, which makes no sense and is a huge tax drag. And in general, QYLD seems to be an inefficient way to generate that income; at least it has historically. Hope this helps.
Wow I was super glad to get this perspective. Was to focused on dividends before diving into this. Quick question, what happened to the youtube channel? Would be great to see some new content you have great stuff
Just been cranking out blog posts and slacking on the videos. Planning to get back on them soon!
So it’s ok to just use it as income source? Because that is like only thing I would use QYLD for.
Only you can decide. I laid out my case pretty extensively.
“The situation for QYLD is exacerbated in a taxable environment because you’re taxed on every distribution, regardless of whether or not you reinvest it.”
You said you have to pay taxes on every distribution?
But I thought QYLD did return of capital?
Thanks
Not always ROC. The tax benefit of ROC is also only there until your cost basis reaches zero.
Once your cost basis reaches zero, distributions are taxed as LTCG (according to IRS website). LTCG is the most tax advantaged income you can get. I find it so funny that people talk about QYLD without understanding the actual tax implications. I buy QLYD, collect ROC for 9-10 years, then collect tax free income if AGI is under 83k. A fund like this could arguably be a better investment (tax wise) than a 401k.
Once again, that is no different from the tax rate on qualified dividends or selling long term capital gains of an equal amount. The 83k you quoted is for a married couple filing jointly. Single is ~$42k. Nothing to do with a 401k, which is a tax-deferred retirement vehicle.
This is both completely correct and 100% wrong at the same time.
For certain people like me (an early retiree who holds some QYLD) with ZERO earned income, Read: no job. The annual taxes on QYLD and all dividends are zero up to about 75k for me. Not a typo. Zero. Mileage may vary.
Further: Regarding the comment <>
I get your argument – but you can’t have it both ways. Either you are efficiently investing in QQQ/SPY/whatever and selling shares for food — or you are playing the arguably less-efficient dividend game and NEVER selling your shares. I agree with you on much of this article – but again, you can’t have it both ways.
Also, if ‘ if you don’t actually need that income on a monthly basis’ as you have stated –then you have WAY too much money and most likely any approach will work.
I don’t understand what you’re getting at, Jim. Using dividends as income is still just mental accounting, regardless of retirement age or tax bracket, and does not magically mean you never have to sell shares. Not sure what you mean by “have it both ways.” One is able to hold a covered call fund or a dividend fund alongside Growth funds that pay little to no dividends.
interesting, what do you think about QYLG?
it writes cover calls only for 50% and keep other 50% to benefit from potential growth
Same thoughts, just not as bad. Looks like QYLG has very low AUM so far.
what’s your thought on JEPI and NUSI ?
Wrote a separate post on NUSI. Haven’t looked into JEPI yet.
Covered call etfs will likely outperform over the next decade as avg annualized returns are expected to be a measly 3-5% for US equities, possibly averaging lower for growth (Vanguard estimates -0.6%-2.4%). Modest gains and modest drawdowns are key, the avg returns of the last decade will not be seen again anytime soon. Running the math with avg implied volatility the sp500 would need to gain over 1.45-1.55% in a month to outperform the covered call strategy in any given month. At this moment it would have to rise roughly 2.5% due to high volatility, with breakeven on a covered call a month out being around 120 points below current price. So it does offer downside protection. Doing it though a fund will eat into profits of course, but still can see excellent returns.