Financially reviewed by Patrick Flood, CFA.
Most investors – even professionals – fail to beat the market. Can it be done? Perhaps. Here we'll explore how to beat the market using leverage and index investing.
Disclosure: Some of the links on this page are referral links. At no additional cost to you, if you choose to make a purchase or sign up for a service after clicking through those links, I may receive a small commission. This allows me to continue producing high-quality content on this site and pays for the occasional cup of coffee. I have first-hand experience with every product or service I recommend, and I recommend them because I genuinely believe they are useful, not because of the commission I may get. Read more here.
Contents
Can You Beat the Market?
Yes and no. Technically, yes of course it's possible. Perhaps the most famous example is Warren Buffett. But you're not him. Moreover, for the most part, his investing style provided excess exposure to the Value and Quality factor premia historically, nearly fully explaining his above-market returns.
For most investors, the answer to the question above is an emphatic “no.” It is well known that the vast majority of investors – even professional fund managers – fail to beat the market, even in bear markets. If you've arrived on this page, you likely already know that fact. I won't delve into the details and the data too much, but I'll provide a brief overview to set the context for the discussion below on how to beat the market.
Institutional investing, which is responsible for the majority of invested assets, is largely a zero sum game, as skilled managers are competing with each other in a global market. Fund managers' underperformance for their clients is then exacerbated by fees.
Arguably more importantly, there will always be an asymmetry of information that acts as one of the many disadvantages for retail investors compared to institutional investors. Hedge funds and pros on Wall Street spend a huge amount of time and resources to get information weeks, days, even minutes before that information is made public. Thus, there's an argument to be made that any information available to the average retail investor like you or me has already been priced in to a stock's share price in a reasonably-efficient market. The sooner you accept this unfortunate fact, the better your long-term returns will be.
Active management and stock picking also introduces additional uncompensated risk in the form of excess exposure to single companies, and decreases reliability of outcome. As John Bogle, considered the founder and father of index investing, said, buy the whole haystack instead of trying to find the needle. Even Buffett himself advises retail investors to buy a plain ol' S&P 500 index fund with low fees, which is where he's instructed most of his wife's inheritance to go.
So why am I spending time discussing why it's nearly impossible to beat the market in a post that's supposed to be about how to beat the market? To set the stage for a tactic that is statistically the best way to assume additional, compensated risk: combining leverage with tried-and-true index investing.
What Is Leverage?
Leverage refers to increased investment exposure through borrowing, without additional capital outlays. In a nutshell, taking on leverage means taking on more risk – and more volatility – for the potential of greater reward. If you've bought a home with a mortgage loan, you've used leverage.
Excluding options and futures contracts (complex derivatives for advanced traders), investors can take on leverage via leveraged ETFs – ETF products that provide enhanced exposure – or through margin, a collateralized loan from your broker against your portfolio in a taxable brokerage account. An example of a leveraged ETF is the Ultra S&P500 (SSO) from ProShares, seeking to deliver 200% of the daily returns of the S&P 500 Index. An example of a margin loan is the relatively cheap margin from M1 Finance known as M1 Borrow.
An investment of $100 in SSO gets you $200 of exposure. If the S&P 500 goes up by 10%, SSO goes up by [roughly] 20%, so you've now achieved a $20 gain instead of just a $10 gain. Borrowing 35% against your invested balance (the max for M1) gets you $135 of exposure for your $100 investment. A 10% rise in value of the assets gets you a $13.50 gain in this example instead of a $10 gain. These examples obviously ignore the costs of borrowing.
I won't delve into the specifics of leveraged ETFs here. I did that in a separate post. Just know that because they reset daily, they won't behave quite the same as a margin loan. That said, with leveraged ETFs, you can only ever lose the capital you put in. With a margin loan, in some cases, depending on your leverage ratio and your broker's maintenance requirement, you can lose more than you put in, potentially plunging you into debt if the market crashes and the amount you owe is greater than the value of your investments. At the very least, you'd trigger what's called a margin call, where you either have to deposit cash to make up for the loss or sell your investments. Also note that margin is usually only available for taxable accounts and cannot be used in retirement accounts, whereas most brokers allow leveraged ETFs in retirement accounts.
Leveraged ETF naysayers cite volatility decay from their daily resetting (also known as beta slippage) as a reason to never hold them long-term. I've delved into this topic in previous posts but it bears repeating briefly here. If the underlying index moves up consistently with decent momentum, volatility decay actually works in your favor. This is why UPRO, the 3x leveraged S&P 500 ETF, has delivered close to 5x the returns of the index since its inception instead of the proposed 3x. In short, holding leveraged ETFs for more than a day is not the boogeyman it's made out to be. If you’re curious to see the math, I would encourage you to check out this page.
It’s also actually been proposed that investors should not only diversify across assets but also across time, employing leverage early in one’s investing horizon to actually reduce risk near retirement by effectively spreading out your money more equally so that one single year affects the portfolio to a lesser degree than it otherwise would (think sequence risk). I myself utilize long-term leverage in my own portfolio with funds like NTSX (1.5x 60/40), UPRO (3x S&P 500), and TMF (3x long-term treasury bonds). I even designed some leveraged versions of popular lazy portfolios like the All Weather Portfolio and the Permanent Portfolio. I reviewed some of the best leveraged ETFs here.
In short, while it's definitely important to understand the fundamental nature and potential pitfalls of the use of leverage, it can be an extremely powerful tool and I have no problem holding a highly-liquid, broad leveraged index fund over the long term. Remember though that with that increased exposure comes greater volatility and risk. If the S&P 500 falls 10%, a 2x leveraged fund will fall 20%. As such, leverage is likely only appropriate for experienced investors who have a high tolerance for risk.
Utilizing leverage is much more important and impactful for young investors with a small amount of capital, allowing them to increase exposure to stocks while young, and have a more consistent exposure on average across their investing horizon, which is the whole idea behind Lifecycle Investing.
How To Beat the Market Using Leverage
The stock market has historically returned about 8% per year on average. So does a 2x leveraged S&P 500 ETF return 16%? Unfortunately it doesn't quite work out like that. Recall that leverage enhances losses too, dropping further than the market when the market drops, meaning it takes more momentum to come back up easily, e.g. a 33.4% drop in the market would wipe out a 3x leveraged position. Thankfully, the market tends to go up over the long term, and circuit breakers halt daily trading if significant crashes occur.
So how can we beat the market with leverage?
I would submit that a “modest” or “prudent” amount of leverage (100-135%) on a broad stock market index like the S&P 500 is a much more sensible assumption of risk than picking individual stocks, and should allow for market outperformance over the long term. At least it has historically. Here's how a 1.35x leveraged S&P 500 portfolio would have worked out against the S&P 500 from 1985 through September, 2020:
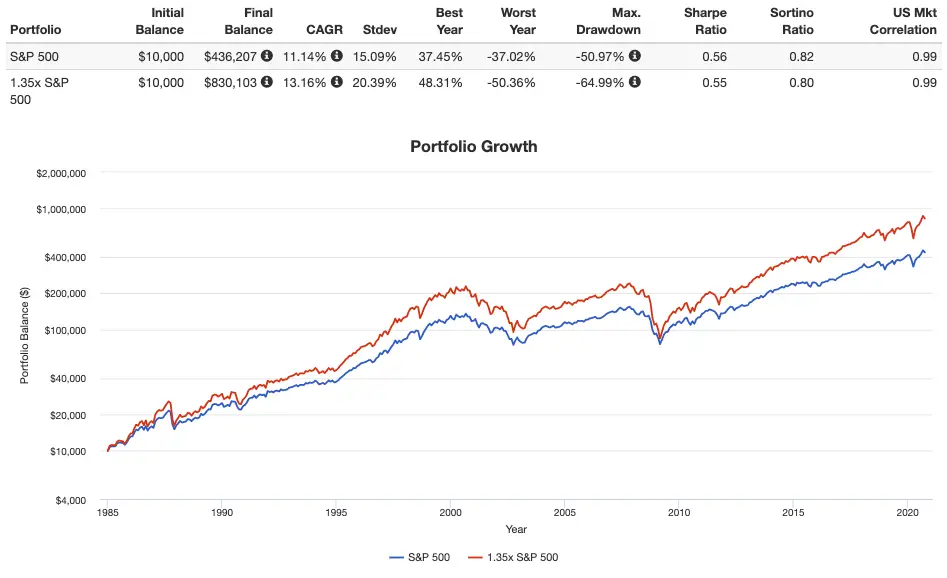
Note, just like I described, the greater volatility and drawdowns, but also the significantly higher return, with a nearly identical risk-adjusted return as measured by Sharpe. Keep in mind that past performance does not guarantee future performance.
I personally wouldn't go past about 2x with 100% stocks, as drawdowns start to become too great in my humble opinion, risk-adjusted returns start to diminish, and the portfolio may not recover for a long period of time. The paper I linked earlier found the optimal leverage for the S&P 500 to be about 2. Above that, you'll likely want a hedge like bonds.
So what if we diversify across multiple asset classes? The traditional 60/40 Portfolio (60% stocks and 40% bonds) is said to be a perfect balance of risk and return. Bonds protect the downside, reducing portfolio volatility and risk, making this a popular portfolio for risk-averse investors and retirees.
While the 60/40 Portfolio is almost certainly suboptimal for a young investor with a long time horizon and high risk tolerance, levering up that same position can potentially enhance returns while potentially maintaining a sensible risk profile similar to that of the S&P 500. Below is a backtest of 1.5x constant leverage on a 60/40 portfolio (resulting in 90/60 exposure) using long-term treasury bonds vs. the S&P 500 Index and our previous 135% S&P 500 (using a slightly shorter time period than what we used above, hence the different final balances) from 1987 through September, 2020:
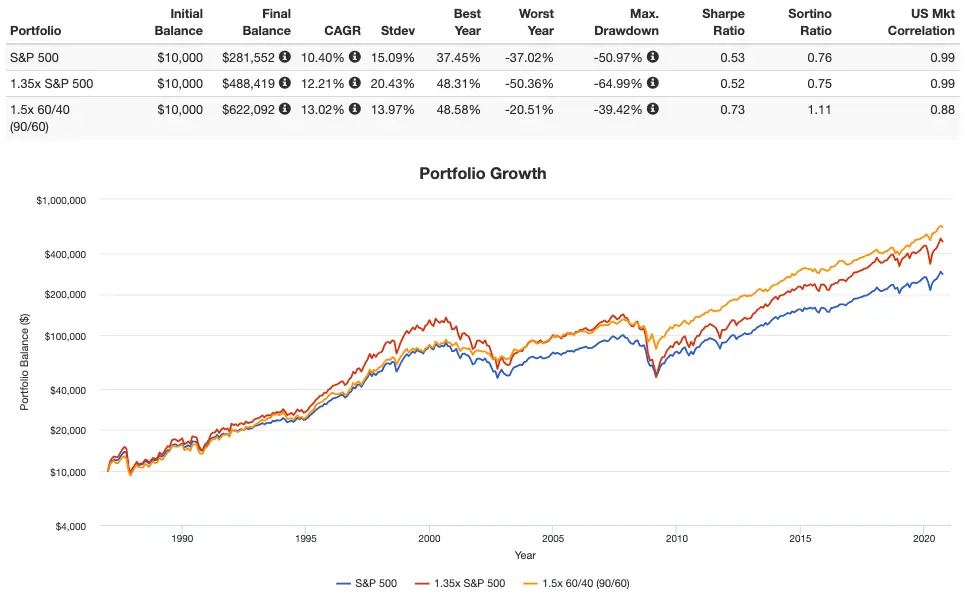
Notice that now not only did we get a considerably higher return, but the 90/60 portfolio actually had lower volatility and smaller drawdowns, and thus a higher risk-adjusted return compared to the S&P 500. NTSX is a relatively new ETF from WisdomTree that delivers this exact exposure; I use it myself in my taxable brokerage account. This is closely related to the concept of “return stacking” from Corey Hoffstein that I explored here. Remember that because they're using derivatives and swaps to borrow, these ETFs won't behave quite the same as a simulated constant leverage.
Taking this example to the extreme, what if we apply 3x leverage to the traditional 60/40 Portfolio? At the time of writing, 3x is the highest leveraged ETF available for the S&P 500 to my knowledge. Below is how that would have worked out historically versus our previous example:
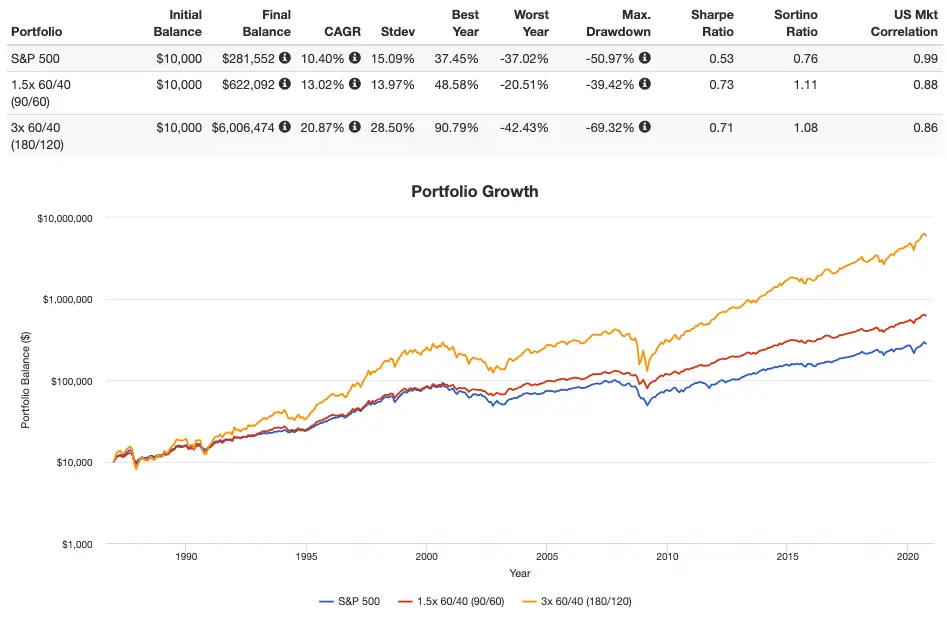
Recall what I said about the risk-adjusted return starting to diminish after a certain point. Here we have a much greater return obviously (talk about market outperformance!), but with much greater volatility and risk and a slightly lower risk-adjusted return than the 90/60 portfolio. Also note that I'm definitely not suggesting you should go put all your money on 3x 60/40, despite how enticing the image above looks. At the end of the day, it will come down to your personal time horizon and risk tolerance. This nominal exposure of 180/120 is actually very close to a now-famous portfolio proposed by a member of the Bogleheads forum called Hedgefundie. I wrote about this portfolio strategy in detail here if you're interested.
With interest rates as low as they are, bonds may not provide the same downside protection that they have in the past. Enter other assets like gold. While gold may not be a reliable inflation hedge, it inarguably offers at least a short-term diversification benefit due to it being uncorrelated to both stocks and bonds.
The famous All Weather Portfolio from Ray Dalio utilizes stocks, bonds, commodities, and gold. It's extremely popular because it minimizes portfolio volatility and risk and is designed to “weather” any economic environment. This extreme diversification usually sacrifices returns, but what if we apply some leverage? Levering up the All Weather Portfolio may provide somewhat of a “middle ground” for those wanting to employ leverage and take on risk but still be well diversified across multiple asset classes.
We can't easily lever up commodities, and I'm not a big fan of them anyway; I wrote in detail about swapping them out for Utilities here. Making that switch and using 2x for gold and 3x for the other assets (there are no longer any 3x gold ETF products available), below is a backtest roughly illustrating how this leveraged All Weather Portfolio would have performed versus our previous 1.5x 60/40 (90/60) and 3x 60/40 (180/120) from 1987 through September, 2020:
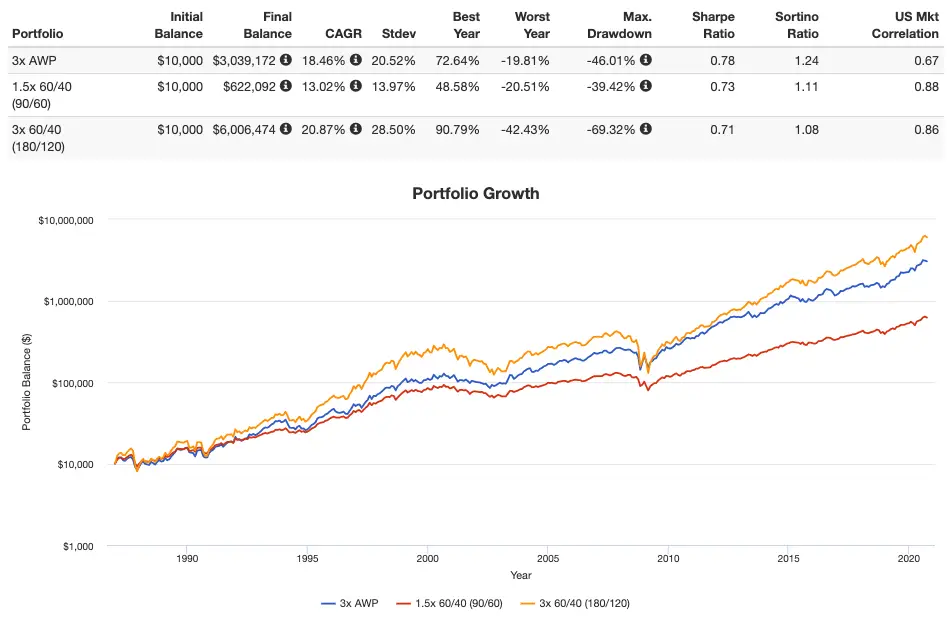
Notice the greatest risk-adjusted return (Sharpe) for this leveraged All Weather Portfolio. It achieved a lower return than the 180/120 but had significantly lower volatility and smaller drawdowns. The 90/60 still carried the lowest volatility and risk of these three portfolios, but its comparatively lower return still resulted in it having a lower risk-adjusted return than the 3x AWP. If you're using M1 Finance, you can grab this 3x AWP portfolio here.
Conclusion
Even with all the fundamental and technical analysis in the world, the market is nearly impossible to beat for average DIY retail investors picking stocks. Statistically, using leverage – borrowing to increase asset exposure – on a broad index provides the best chance for beating the market, and can be a useful tool for investors with a high tolerance for risk, especially those with a long time horizon and a small amount of capital.
While there are definitely important risks associated with the use of leverage, I maintain that applying a modest amount of leverage to a broad index or levering up a well-diversified portfolio is a far better, easier, and less time-consuming assumption of excess risk than stock picking.
In any leveraged portfolio, a strong stomach will likely be required during periods of market turmoil. Remember to regularly rebalance any leveraged portfolio if your allocations stray significantly from their intended targets. This is less of a concern with a brokerage like M1 Finance that automatically rebalances your portfolio using new deposits.
Also remember that using leverage – especially in the form of leveraged ETFs – increases portfolio risk and the potential for greater returns, but also the potential for greater losses. Do your own due diligence.
Which of the above strategies would you go with? Let me know in the comments.
Disclosures: I am long NTSX, UPRO, and TMF in my own portfolio.
Disclaimer: While I love diving into investing-related data and playing around with backtests, this is not financial advice, investing advice, or tax advice. The information on this website is for informational, educational, and entertainment purposes only. Investment products discussed (ETFs, mutual funds, etc.) are for illustrative purposes only. It is not a research report. It is not a recommendation to buy, sell, or otherwise transact in any of the products mentioned. I always attempt to ensure the accuracy of information presented but that accuracy cannot be guaranteed. Do your own due diligence. I mention M1 Finance a lot around here. M1 does not provide investment advice, and this is not an offer or solicitation of an offer, or advice to buy or sell any security, and you are encouraged to consult your personal investment, legal, and tax advisors. Hypothetical examples used, such as historical backtests, do not reflect any specific investments, are for illustrative purposes only, and should not be considered an offer to buy or sell any products. All investing involves risk, including the risk of losing the money you invest. Past performance does not guarantee future results. Opinions are my own and do not represent those of other parties mentioned. Read my lengthier disclaimer here.
Are you nearing or in retirement? Use my link here to get a free holistic financial plan and to take advantage of 25% exclusive savings on financial planning and wealth management services from fiduciary advisors at Retirable to manage your savings, spend smarter, and navigate key decisions.


Hi John, long time follower and a rare implementor. However, I’ve gotten busy and struggling to keep up with the market to implement a successful trend following strategy. Thinking of running a leveraged portfolio for a small part of my networth (previously “actively” trend following)
Two things:
1. Thinking of implementing a strategy to dollar cost average that rebalances between NTSX and 60/40 UPRO/TMF. Portfoliovisualiser here https://www.portfoliovisualizer.com/backtest-portfolio?s=y&sl=5ctVJK12U6sIVKhGwjkpuo
Seems to have a higher cagr and similar sharpe/sortino ratio to 3 x AWP (Util). Anything that looks unreasonable here (other than not being able to test before 2005)
2. How did you get portfoliovisualiser to simulate all weather portfolio (Util) beyond the start date of GLD? I can’t go before 2005
Do you have any thoughts on implementing this to your Ginger Ale portfolio?
like 25% US large cap –> 2% UPRO + 19% IVV, 10% long term treasury –> 2% TMF+ 4% EDV (2% are random#)
because ive been following Ginger Ale for one year, and also playing with HFEA (for fun) for one year now, then i often came to mind that can i combine them so i don’t have to worry two separate portfolio or weightings on each and they do have target section that overlaps.
I personally don’t like customization because I don’t want to bring my personal bias.
I also understand that we want to avoid over-optimization for sacrificing convinience, but i’m now used to these strategy and + just pure academic curiosity.
Thank you.
Hello. Great Content!
Why performance of UPRO and SSO have very different GAPs based on different time frames. For Example 1 month (31,3% x 20,91%) – what make a lot of sense due to leverage ration, but for 5 years 12,2% X 13,86%?
(Source etf.com comparison Tool as of 11/18/2022)
UPRO is 3x and SSO is 2x.
Thanks John, I’ve learned a lot from reading your website and am intrigued by NTSX. How did you apply various multiples of leverage in Portfolio Visualizer? It looks like portfolio weights are constrained to 100%, and I was hoping to test other diversified examples using NTSX, e.g., adding commodities given the current market environment.
They have a leverage field now. You can also simply do greater than 100% for a fund and use negative CASHX to simulate borrowing.
Is it impossible for e.g. UPRO to get wiped out by a 33.4% single day drop in SP 500 thanks to market circuit breakers?
Also, is 33.4% the wipe out number for only a *single* day drop? E.g. is UPRO ok if SP 500 drops 17% one day and then another 17% the next day?
Thanks!
Technically yes and yes.
Thank you for your good post. I plan to invest in the SSO + UBT 60/40 investment portfolio, hold it for a long time, and run performance backtests with twice the leverage. The risk value is very low. This advantage is to avoid a 33.4% drop in the market. The possibility of liquidation of the stocks with double leverage, the risk of 2X leverage can avoid such in-depth backtesting. Are there any other risks that need to be considered for long-term holding? Thank you~
First, I want to thank you John for writing such fantastic articles on leveraging and using detailed portfolio visualizer back-tests to show the results.
Something that came to mind as an improvement over the S&P for equities exposure would be using a Global Min Vol strategy in tandem with a Global Quality strategy.
One would solve home country bias, improve diversification with international stock exposure and lower standard deviation.
For instance the MSCI global min vol index provides roughly the same annualized returns 0.5+ (since 1988) as its global parent index whereas the quality index outperforms by over 3+ percent (since 1994).
MSCI world min vol pdf: https://www.msci.com/documents/10199/4d26c754-8cb9-4fa8-84e6-a51930901367
MSCI world quality index pdf: https://www.msci.com/documents/10199/344aa133-d8fa-4a15-b091-20a8fd024b65
Where the min vol strategy in particular shines is in down years for global markets:
2008 -29 vs -40
2011 +8 vs -5
2015 +5 vs 0
2018 -1 vs -8
With more defensive equity at 40-50% (that actually outperforms its global parent index when combined) in tandem with alternatives at 10-15% and bonds at 40-50% you’d have a more efficient portfolio (globally and factor diversified) that would experience less drawdowns with leverage.
Just some food for though for those considering such investing. Again, like you, I am not a financial professional nor do I give financial advice so anyone considering such a strategy would need to consult with a professional and come their own conclusions before trying something like this out.
Thanks! IIRC, low vol is explained by Profitability (RmW) and Investment (CmA). Quality is basically interchangeable with Profitability.
Arguably, the multi-year decline in rates result in the min vol phenomenon. Similar to the bond bull market. If we are assuming that the 60/40 may not be best given the recent rate environment, this may also not be best.
I’ve been curious about LEAPS as a method to gain leverage as an alternative to the daily levered ETFs. Seems like there are some notable pros and cons of LEAPS vs levered ETFs. Would you consider tackling a comparison in an article or video? Everything I’ve found is either opinion based and shallow or way over my head. Also, how much can we expect rising rates to increase drag on levered ETF performance as borrowing cost increases? I appreciate your content here and YT. One of the best in the game!
Quick question, do you know if fund fees are consider in the back testing form portfolio visualizer? I googled around and went on Reddit but couldn’t find an answer on that. I’m interested in either the 3x AWP or the Hedgefundie Adventure as sort of a “side portfolio” and I noticed the fees for the 3x AWP are almost double.
Thanks!
Yes, returns are net of fees. Fees of 3x AWP shouldn’t be much different from HFEA. Maybe you were looking at Mototrojan’s variant with EDV?
Hello,
I am in my mid 30s in Canada and thinking of leveraged investing. Specifically, plan is to borrow $100k from bank using line of credit at interest rate of 2.2% (able to get this rate as I am a physician) and invest in a well diversified ETF like VT which is expected to give returns of 7-10% per year in long term. I can afford the $2200 per year of interest charges. Have no problem with buy and hold strategy, so will continue to hold the ETF during the downturns. Would you recommend this strategy and is this a good way to generate wealth and reach financial independence sooner? I am still learning about this strategy and I am starting to prefer this over real estate investing as it’s much less work and hands-off. And would you recommend adding some bonds to reduce volatility? Thanks for reading.
I can’t provide personalized advice and we can’t know the future. Diversifying and levering up is an idea that has been around a long time.
Probably a dumb question …
CEFs are also leveraged. I know that they may have different % leverages than these ETFs and they also pay distributions. Are there other differences?
Thanks again!
Two completely different products. CEFs are focused on income via a high yield and decent diversification.
One thing that confuses me about margin is when you pay it back. Let’s say I have 10k in my taxable account and I use M1 Borrow to borrow $3,500 to add to that, paying 2% for the margin.
Every year, I pay 2% of 3,500 = $70. Over 20 years, however, let’s say my portfolio grew at an average annual rate of 5%, leaving me with a tidy sum of $35,819 (assuming no further deposits). Was I simply holding the margin loan every year, paying the interest but not the principal? Do I only pay back the principal when I retire (and thus sell some of my investments)
Yes. Your leverage ratio would be decreasing as the portfolio value grows if you never borrowed more, e.g. $3.5k is 35% of $10k but is only 10% of $35k. So you could borrow more as you go along to maintain that same leverage ratio. You can pay it back as quickly or as slowly as you want.
Thanks for this post; the content is excellent.
Does anyone have strategies around how to deleverage? It makes sense to me to use leverage during an accumulation phase, but it seems like you would want to deleverage into a more stable portfolio at retirement age? Is there a strategy to deleverage over time to avoid the risk of timing the market? Or is it suggested that a leveraged portfolio is a buy-and-hold forever investment?
What is the time horizon where it no longer makes sense to use a leveraged portfolio?
I’m guessing I need to start by reading http://lifecycleinvesting.net/ 🙂
Indeed, deleverage as time passes. Ayres and Nalebuff outlined a protocol, but they also stopped at 2x. What will be an optimal deleveraging protocol for the future? No one knows.
Hi John,
I’ve been interested in adding leverage for some time as I agree with your fundamental premise that individual stock picking or choosing active management is very likely to underperform the broad indexes over the long term, and that I would like to maximize stock exposure particularly during periods of time when the market is relatively cheap.
My portfolio is very simple: 100% VTI. I dollar cost average into more VTI in a taxable account with every pay period and have maxed out contributions to an employer 401k, backdoor Roth IRA and HSA. I’m happy to ride out any “volatility” in the short term as I only care about where VTI will be 20+ years from now.
What seems to be a no-brainer strategy to me is to add leverage in the tax sheltered accounts when the market dips. So, every 5% dip in the market causes me to sell 5% of my VTI holdings and exchange for a 3x leveraged ETF like SPXL. If the market continues to decline, I continue to add leverage via VTI—>SPXL. Then, when the market recovers its old highs, swap the SPXL back into VTI. In this way, I can stay fully invested at all times and add exposure during dips or bear markets. Using the strategy in a tax-sheltered account also eliminates the tax drag from buying and selling – probably wouldn’t employ this in the taxable account just because of all the short term capital gains taxes it would generate.
Provided you believe the market will be higher in 20 years and have the nerve to stick to the plan, what would be the risk adding leverage like this??
First no-brainer would be to add some international stocks; see this post. Secondly, don’t try to time the market. “Buy the dip” doesn’t really work. The timing strategy you describe is unrealistic and is much easier said than done.
John, could you help me make sure my math is sensical and I’m understanding what I’m reading here, on M1, and the links you’re giving? In short, I’m trying to learn how to do the math on the % margin borrowed vs. a MDD you set in your mind vs. how much cash to let sit / how much margin % overhead to leave (i.e., not take the full 35% allowable).
In long:
Are those even the right things to consider?
Let’s say someone wants to open an M1 account, pay for pro, and leverage their portfolio at their currently-very-low margin rates (2%). And let’s say someone is thinking of just going with NTSX since it’s good with the taxes and won’t require capital-gains-inducing rebalances.
Also, that someone doesn’t want to let cash just sit there “doing nothing” but acting as maintenance margin, but also don’t want to leverage the max and get hit with a margin call when there’s no cash nor leverage % remaining (their 2 automatic ways).
If you put the min. $5000 in to start, you could leverage up to 35% = 1750. Putting SPY, IVV, and VOO in the fund performance chart, they’re all around -20% MDD since 2011 while NTSX is -15% since Oct2008. As an example, $6750 could drop to $5400 (-20%). Then you’re at 1750 / 5400 = 32%.
Therefore, you would not get margin called?
A margin call would happen when the total account value drops below $5000, where 1750 would move beyond the 35%?
Would you rather have cash sitting there as maintenance, or leave some margin % available?
Is it worth the lower 1.5% on the margin for the ~$130 pro account?
Sorry this was so long, but you’re website is turning me into a numbers guy. 😉 hehe.
I think I understand what you’re asking.
So first, it doesn’t make sense to borrow money and then hold it as cash, so don’t do that.
Secondly, M1 Plus for the lower rate becomes worth it at exactly $8,333 borrowed ($125 / 1.5%).
Margin call would happen when the value falls below whatever M1’s requirement is for your particular holdings in your account. They give you a little speedometer showing this exact figure when you borrow. In most cases it’s >50% if you’re using “normal” funds like VOO. Different funds have different maintenance requirements; obviously for leveraged funds like NTSX and UPRO, the maintenance requirement is higher.
Hi John, long time follower and a rare implementor. However, I’ve gotten busy and struggling to keep up with the market to implement a trend following strategy. Thinking of running a leveraged portfolio for a small part of my networth (previously “actively” trend following)
Two things:
1. Thinking of implementing a strategy to dollar cost average that rebalances between NTSX and 60/40 UPRO/TMF. Portfoliovisualiser here https://www.portfoliovisualizer.com/backtest-portfolio?s=y&sl=5ctVJK12U6sIVKhGwjkpuo
Seems to have a higher cagr and similar sharpe/sortino ratio to 3 x AWP (Util). Anything that looks unreasonable here (other than not being able to test before 2005)
2. How did you get portfoliovisualiser to simulate all weather portfolio (Util) beyond the start date of GLD? I can’t go before 2005
Great post as always.
I’m reading through Lifecycle Investing now, and find the book’s central argument quite compelling.
However, the research and data that I’ve read on the topic suggests that there isn’t much benefit in going past 1.5x on average. And as you mention, S&P500 funds seem to be the only good candidate for leverage.
Which seems to beg the question of 1.5x leverage of S&P500 vs NTSX, which seems to benefit NTSX if assuming “normal” S&P500 returns and behavior, instead of the exceptional performance we’ve seen of late.
This leads to the question of how to effectively implement leverage for a risk tolerant new investor; at least outside of NTSX/NTSI/NTSE and if someone has access to PSLDX.
If we consider allocating 5-10% of a portfolio (until the goals have been met to remove leverage) to a hedgefundie approach, do you consider the impact to a portfolio significantly different between rebalancing between UPRO/TMF and the rest of your portfolio versus keeping it fully isolated?
Integration would have an added benefits in scenarios where the hedgefundie portion went up over a stretch only to crash down to 0%, since at least some of the gains would be transferred elsewhere. It would have the added downside of being able to syphon from the other funds if it dropped to 0% for multiple years, or simply had poor performance over an extended period of time.
Any idea of which approach would likely produce the higher median or average return?
And would you mind sharing your own approach of how you integrate UPRO/TMF into your broader portfolio?
Thanks Charles!
I’m always a fan of viewing the portfolio holistically unless someone’s throwing a one-time deposit in a “lottery ticket” like the Hedgefundie strategy. I know there was a lot of discussion and disagreement in the original Bogleheads thread over whether or not to view it as a separate bucket or as part of the whole portfolio. Some did the former and others did the latter. But some also did a one-time deposits and others were doing regular deposits. If regularly depositing, it probably makes more sense to view it with the whole portfolio, in which case one could for example achieve 1.2x leverage with 10% UPRO and 90% VOO.
Margin is an option for a taxable brokerage account. In fact, one could put margin on NTSX to probably get close to 2x leverage and be pretty tax-efficient.
I like the idea of using a bond hedge once you pass about 1.5x (NTSX), but below that (let’s say 1.25x), I think a young investor is probably fine still doing 100% stocks (technically, 125% or 125/0), especially given current bond yields and questionable future downside protection by them. NTSX is 90/60, and PSLDX is 100/100 if I remember correctly.
I’ve got a lottery ticket in the Hedgefundie strategy but my total leverage ratio right now is also about 1.8.
Hi John, do you mind going into a bit more detail about how you are able to get your total leverage ratio up to 1.8?
Have you bought on margin? with LEAPs or with LETFs?
I’ve just finished lifecycle investing and they seem to prefer LEAPs or buying ETFs on margin but most of your articles about applying leverage are about LETFs.
Thanks
LETFs and NTSX. It’s probably currently a bit lower around 1.5 because I’m sitting on some I-bonds and TIPS for some short-term goals.
Hello,
Very interesting reading. Thank you for your work.
I am curious about a discrepancy of sorts or more likely misunderstanding on my part that I hope you can comment on-
The numbers for 3xAWP with utils seem different in “How to beat the market” article vs “All weather portfolio” article. For example, CAGR is 18.46 vs 22.98. Similarly, other numbers in the table. You do indicate the numbers are from 1987 onwards in both cases. Are the end dates different? June/2020 vs Sept/2020? Perhaps that explains the difference in numbers?
Thanks.
Ted, thanks for catching that and sorry for the discrepancy. I’m thinking different end dates and/or one is using my simulation data and one isn’t. I’ll try to dig in and let you know.
Thanks for your work making the difficult easier to understand.
I see in your disclosures, you no longer show PSLDX. Any reason you switched out? Or, did you add it later than this article?
PSLDX also might be added to this leveraged article.
Best wishes,
PM
Glad you found the content useful! This post doesn’t mention PSLDX so it’s not in the disclosure at the bottom. I do still own it. I didn’t include it in this post because it’s pretty hard to access and is only available at a small handful of brokers.
Thanks for the great post! What are your thoughts on PSLDX vs the Hedgefundie UPRO/TMF blend as it looks like you are utilizing both? How did you decide what to apply to the different strategies? I’m a younger investor with high income, stable job and lots of tax protected space in 401k, Roth etc. I am already invested in PSLDX in the Roth and NTSX in taxable brokerage and while it looks like the Hedgefundie approach is quite interesting and higher historical (backtested) returns I think it leaves more potential for behavioral variation (ie letting some outperformance ride a bit, or getting busy with work/family and not rebalancing for a while etc).
Thanks Noah. PSLDX is completely hands off but of course you pay a fee for that convenience. Hedgefundie (UPRO/TMF) is more hands-on and can be tweaked to one’s liking. Yes, the latter can lead to much more behavior-based trading decisions.