Two of the most popular stock market index ETFs are the Vanguard S&P 500 ETF (VOO) and the Vanguard Total Stock Market ETF (VTI). Here we'll dive into their differences, similarities, and performance.
Disclosure: Some of the links on this page are referral links. At no additional cost to you, if you choose to make a purchase or sign up for a service after clicking through those links, I may receive a small commission. This allows me to continue producing high-quality content on this site and pays for the occasional cup of coffee. I have first-hand experience with every product or service I recommend, and I recommend them because I genuinely believe they are useful, not because of the commission I may get. Read more here.
In a hurry? Here are the highlights:
- VOO and VTI are the two most popular U.S. stock market ETFs out there. Both are from Vanguard.
- VOO tracks the S&P 500 Index. VTI tracks the CRSP US Total Market Index.
- As such, VOO is entirely large-cap stocks, while VTI also includes small- and mid-cap stocks.
- VOO and VTI have an overlap of roughly 82% by weight.
- Specifically, VOO is already inside VTI.
- VTI has been – and should be expected to be – slightly more volatile than VOO.
- Since it contains small- and mid-caps, which have outperformed large caps historically due to the Size factor premium, we would expect VTI to outperform VOO over the long term, and indeed it has historically.
- VOO has roughly 500 holdings and VTI has roughly 3,500 holdings, so VTI can be considered more diversified.
- Both VOO and VTI have the same expense ratio of 0.03%.
- VTI's securities lending revenue drops its net cost to about 0.02%, but VOO's is basically negligible, so its net cost stays around 0.03%.
- VOO and VTI have nearly the same dividend yield and the same great tax efficiency.
- VOO and VTI are a great pair for tax loss harvesting to avoid the wash sale rule.
- VTI is more popular than VOO.
Contents
VOO vs. VTI – Comparison Table
Before getting into the details, here's a quick comparison table of VOO vs. VTI:
| VOO | VTI | |
|---|---|---|
| Full Name | Vanguard S&P 500 ETF | Vanguard Total Stock Market ETF |
| Index | S&P 500 Index | CRSP US Total Market Index |
| Inception | 2010 | 2001 |
| Mutual Fund Equivalent | VFIAX | VTSAX |
| ETF AUM | $860B | $570B |
| Total Fund AUM (all share classes) | $1.5T | $2.0T |
| Holdings | 504 | 3,517 |
| Expense Ratio | 0.03% | 0.03% |
| Securities Lending Income (FY2025) | $10M (0.0007%) | $194M (0.01%) |
| Effective Net Cost | 0.03% | 0.02% |
| Portfolio Turnover | 2.3% | 2.1% |
| U.S. Market Coverage | 80% | 100% |
| Large-Cap Weight | 100% | 82% |
| Mid-Cap Weight | 0% | 12% |
| Small-Cap Weight | 0% | 6% |
| Index Selection | Committee | Rules-based |
| 30-Day SEC Yield | 1.2% | 1.2% |
| Qualified Dividend % | ~100% | ~95% |
VOO vs. VTI – Video
Prefer video? Watch it here:

VOO vs. VTI – Differences in Methodology and Composition
If you've landed here, you probably already know that stocks are a significant driver of portfolio returns, and that index funds are a great, low-cost way to get immediate, broad diversification across asset classes. You also probably already know that Vanguard has some of the lowest fees around and has a solid track record of providing ETFs that accurately track their indexes.
The Vanguard S&P 500 ETF (VOO) is one of the most popular stock ETFs out there. It was established in 2010. The fund seeks to track the famous S&P 500 Index, holding the 500 largest U.S. companies. This index is considered a sufficient proxy and barometer for “the market” in the U.S. The mutual fund equivalent for VOO is VFIAX.
The Vanguard Total Stock Market ETF (VTI) provides similar broad exposure to the U.S. stock market, with the addition of small- and mid-caps. It was established in 2001. The fund seeks to track the CRSP US Total Market Index. This ETF holds over 3,500 U.S. stocks across all cap sizes. Specifically, VTI is comprised of roughly 82% large-cap, 12% mid-cap, and 6% small-cap stocks. In other words, VOO comprises roughly 82% of the broader VTI, so they have significant overlap. Put more simply, VOO is already inside of VTI. There is no stock in VOO that is not also in VTI. The mutual fund equivalent for VTI is VTSAX.
People hear of these two popular ETFs and wonder which one they should go with, or if they should utilize both. It is one of the questions I see asked most often on Reddit.
The only real difference between VOO and VTI is that VTI includes small, mid, and large cap stocks, while VOO is only large-cap stocks. Since VTI is market cap weighted, meaning weighted by the size (the market capitalization) of the constituent stocks, about 82% of VTI's weight is VOO, with the other 18% being those smaller companies. That 18% is about 3,000 stocks.
Since small- and mid-cap stocks tend to be more volatile than large-caps, VTI should be – and has been – slightly more volatile than VOO. Because VOO holds about 500 stocks and VTI holds about 3,500, VTI can also be considered more diversified than VOO.
In the interest of specificity, VOO does technically contain some stocks that certain classification systems would call “mid-cap.” The S&P 500 requires a minimum market cap of about $23 billion for new additions as of 2025, but existing members can drift below that level without being removed. Some companies sitting near the bottom of the S&P 500 fall in the range that Morningstar or Russell would classify as mid-cap. So if you've ever seen VOO listed as holding 16% mid-cap on Morningstar's style box, that's why – it's a definitional artifact, not a sign that VOO is secretly a blended fund.
The S&P 500 is also committee-selected, not purely rules-based like the CRSP index that VTI tracks. An Index Committee considers sector representation and other qualitative factors beyond just market cap and earnings. This is a feature by some lights (a basic quality screen) and a potential liability by others (scheduled additions are announced in advance, allowing front-running that costs index shareholders slightly at each reconstitution).
So one could reasonably argue VTI is more “passive” than VOO.
Now let's look at the performance of VOO vs. VTI.
VOO vs. VTI – Historical Performance
VOO has delivered an 8.54% CAGR historically with VTI at about 8.73%.
Note that small- and mid-cap stocks have outperformed large-caps historically because they are considered riskier; this is known as the Size risk factor premium. Thus, we would expect VTI to slightly outperform VOO over the long term, and indeed it has historically. Here's a look at their mutual fund equivalents going back to 2000:
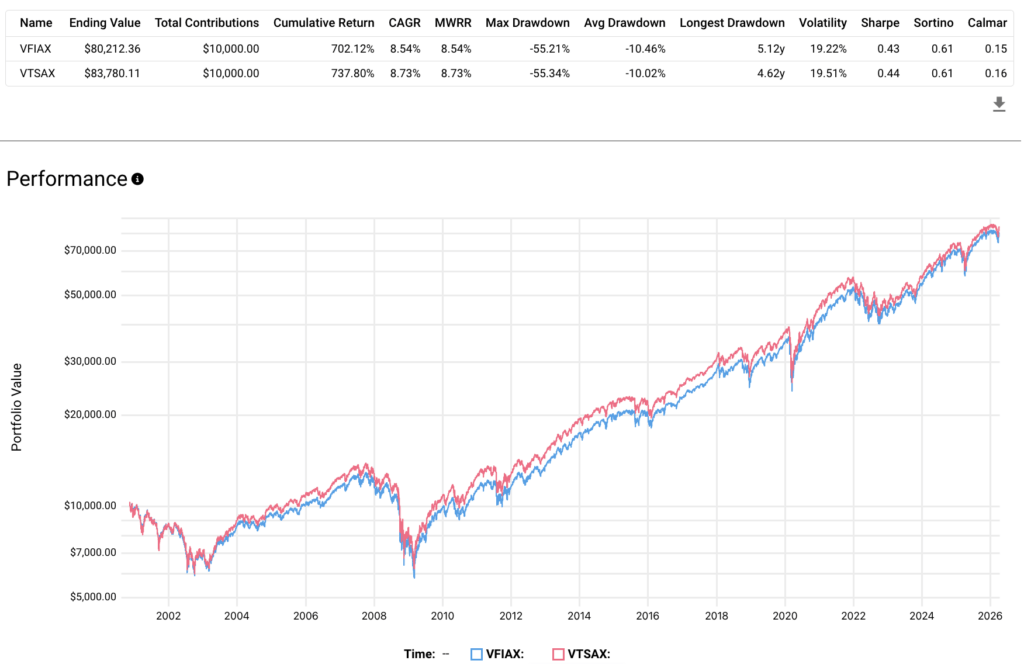
As we'd also expect due to its inclusion of smaller stocks, VTI has been slightly more volatile than VOO, meaning its variability of returns – measured by standard deviation – has been greater; VOO's annualized standard deviation is approximately 19.2%, and VTI runs slightly higher at roughly 19.5%.
VTI has delivered a higher return, and as a result, technically an ever-so-slightly higher risk-adjusted return as measured by Sharpe ratio. For practical purposes though, we'd say Sharpe is nearly identical between the two.
VOO has outperformed VTI by about 0.4% annually over roughly the past decade (2016-2025), as the mega-cap tech names that dominate VOO's portfolio – Nvidia, Apple, Microsoft, Amazon, Meta, Alphabet, etc. – have had an extraordinary run. Those same names also appear in VTI, but they get slightly diluted by ~3,000 smaller stocks that largely didn't keep pace. When large-caps lead, VOO wins. When small caps lead, VTI wins.
The correlation between the two funds sits at 0.99. They move together for all practical purposes. For most investors, the practical performance difference in any given year will be imperceptible.
A Brief Note on That Size Premium of Small Caps
I mentioned we'd expect VTI to beat VOO over the long term due to a Size premium for small caps, but there's a little more nuance – and uncertainty – to that story.
The basic idea is that small-cap stocks outperform large caps over time because they're riskier, and investors demand higher expected returns to compensate. This is the SmB (Small minus Big) factor from Fama and French's 1993 three-factor model, and it's frequently invoked to argue that VTI should outperform VOO over long horizons.
The Fama-French SmB factor did average roughly 2.9% per year in the original research, but with an annualized standard deviation of 11.5%. The Size factor was always the weakest leg of the three-factor stool, and its CAPM alpha wasn't even statistically significant.
To add a bit more dismay, the premium has largely failed to show up since Banz first documented it in 1981. The Russell 2000 has underperformed the S&P 500 by substantial margins over various long periods since then. A big junk of Russell 2000 companies are unprofitable at any given time. Passive small-cap exposure means buying a lot of structural underperformers alongside any genuine gems.
The most rigorous recent work on this comes from Asness, Frazzini, Israel, Moskowitz, and Pedersen in 2018 in the Journal of Financial Economics, titled “Size Matters, If You Control Your Junk.” They found the size premium without quality control showed an alpha of just 1.7% per year (statistically insignificant), but that after filtering out low-quality stocks, alpha jumped to 5.9% per year (highly significant).
The implication is that the Size premium is real, but it exists specifically in high-quality small-cap stocks, not the junk-heavy blend you get from a cap-weighted total market fund. In other words, you can effectively resurrect the premium with some financial screens.
The bottom line for our comparison here of VTI vs. VOO is that VTI's ~20% non-large-cap allocation may not be as reliable of an engine of excess returns as many make it out to be. It provides genuine diversification and avoids the S&P committee's selection discretion, but investors shouldn't expect VTI to significantly outperform VOO long-term purely because it holds more small-cap stocks.
If capturing the Size premium is your goal, a dedicated small cap value fund that screens for earnings may be the way to go. That's why I pair VOO with a small cap value fund in my own portfolio rather than just holding VTI.
VOO vs. VTI – Dividend Yield
Dividend yields are nearly identical: VOO at 1.16% and VTI at 1.17%. For investors who prefer slightly lower dividend income to reduce tax drag in taxable accounts, the difference here is immaterial.
On qualified dividends specifically, VOO produces essentially 100% qualified dividends, since it holds only large-cap domestic stocks long-term. VTI produces approximately 95% qualified dividends, with the remaining ~5% coming from REIT holdings and certain small-caps. The practical tax difference on, say, a $100,000 position at a 24% marginal rate is roughly $13 per year, so nothing to lose sleep over.
VOO vs. VTI – Tax Efficiency
Both VOO and VTI are very tax-efficient.
VOO has never distributed a capital gain since its 2010 inception, and VTI has never distributed a capital gain since its 2001 inception.
The mechanism behind this is Vanguard's dual share-class structure. Both VOO and VTI are ETF share classes of larger Vanguard mutual funds. When institutional investors redeem ETF shares, they receive appreciated securities back “in-kind” rather than cash. This in-kind redemption removes low-cost-basis stocks from the portfolio without triggering a taxable event for remaining shareholders.
Vanguard patented this structure in 2001 – Bloomberg described it as a “tax dialysis machine” – and held the patent until May 2023. Research published in the Review of Financial Studies estimated this ETF tax efficiency advantage adds roughly 1.05% per year in after-tax returns relative to comparable mutual funds over a long holding period.
A Great Tax Loss Harvesting Pair
One practical advantage of holding VOO or VTI is that they make excellent tax loss harvesting partners for each other.
The IRS wash sale rule disallows a capital loss if you sell a security and buy a “substantially identical” security within 30 days before or after the sale (61-day window total). VOO and VTI track different indexes from different index providers (S&P Dow Jones vs. CRSP), hold different numbers of securities (~504 vs. ~3,500+), and have materially different market coverage (large-cap only vs. full market), so they are definitely not substantially identical.
That said, obligatory disclaimer to consult a tax professional for your specific situation, etc.
Disable automatic dividend reinvestment before harvesting. An automatic reinvestment during the 30-day window can inadvertently trigger a wash sale.
VOO vs. VTI – AUM
In terms of size, VOO and VTI are both enormous.
VTI is a share class of Vanguard's Total Stock Market Index Fund, which now holds roughly $2 trillion across all share classes, making it one of the largest mutual funds in existence. VTI's ETF share class alone holds approximately $570 billion.
VOO, meanwhile, is a share class of Vanguard's 500 Index Fund, holding around $1.5 trillion total. VOO's ETF share class recently crossed $860 billion, which was enough to overtake SPY as the world's largest ETF by assets in 2025, a milestone that would have seemed implausible a decade ago given how entrenched SPY was in that role.
Both funds are extremely liquid with tight bid-ask spreads.
VOO vs. VTI – Fees and Turnover
Expense ratio for VOO and VTI is the same at a low 0.03%. That said, the stated expense ratio isn't quite the full picture (more on that in the securities lending section below).
Portfolio turnover – the amount of trading the fund is doing – is minimal for both. VOO runs around 2.3% annually and VTI around 2.1%, in line with what you'd expect from passive, market-cap-weighted funds that rarely need to trade except during index reconstitutions or rebalances.
Securities Lending – The Hidden Fee Offset
Here's something most comparisons skip over entirely. Both VOO and VTI participate in Vanguard's securities lending program, which loans out fund holdings to short sellers and other institutional borrowers in exchange for collateral and a fee. That fee gets returned to fund shareholders, which means the effective cost of ownership is lower than the stated 0.03% expense ratio, sometimes meaningfully so.
The reason this matters for the VOO vs. VTI comparison is that VTI benefits much more from securities lending than VOO does.
Small-cap stocks are harder to borrow and therefore command higher lending fees than large caps. Short sellers targeting obscure small-cap names pay a premium to borrow them, and that premium flows back to VTI shareholders. VOO's portfolio is entirely large-cap blue chips, which are easier to borrow, so it results in much lower lending revenue, usually a negligible amount.
VOO's lending income is a rounding error. According to the Vanguard 500 Index Fund's Statement of Operations (N-CSR, fiscal year ended December 31, 2025), the fund earned $10,002,000 in net securities lending income. That may sound like a lot, but on a total fund asset base of roughly $1.5 trillion, that comes out to 0.0007%. For 2024, the figure was even more modest at $2,709,792 net (from the fund's SAI), or roughly 0.0002% on approximately $1.1 trillion in AUM.
As you can see, those numbers round to zero.
S&P 500 constituents are large, liquid, and easy to borrow; nobody's paying a premium to short Apple or Microsoft. Lending revenue on investment-grade blue chips is essentially a favor to shareholders, not a meaningful economic offset.
VTI's lending income is a different story entirely. The Vanguard Total Stock Market Index Fund's Statement of Operations for fiscal year 2025 shows $194,031,000 in net securities lending income, roughly 19x VOO's absolute figure. On a per-asset basis, that works out to approximately 1.0 basis point of lending income against a 3 basis point expense ratio. That is, 0.01% clawed back versus a gross expense ratio of 0.03%. For 2024, VTI earned $177,518,964 net, translating to roughly 1.2 basis points on approximately $1.5 trillion in AUM.
The mechanism behind this gap is exactly what you'd expect. VTI's extra ~3,000 holdings relative to VOO are small- and mid-cap names, many of which are heavily shorted by hedge funds and arbitrageurs. Borrowers pay a premium to access scarce, in-demand shares, and VTI's shareholders collect.
In the interest of full disclosure to drive this point home, the Extended Market Index Fund (VXF – essentially VTI minus VOO, so just the smalls and mids) earned ~$82 million in lending income for fiscal year 2025 on a fund with assets of “only” about $85 billion, tiny compared to VOO and VTI, implying approximately 9 basis points – or 0.09% – of lending revenue. That's the isolated contribution from small- and mid-cap holdings, and it flows into VTI blended down by the roughly 80% large-cap base that earns almost nothing.
In other words, VTI carries a structural lending advantage that VOO – by its very nature as a U.S. large-cap fund – cannot replicate.
The net result of all this is VTI's effective annual cost after the lending revenue offset is approximately 0.02% rather than the stated 0.03%, while VOO's effective cost remains the same at the stated 0.03%. Of course, that tiny difference of 0.01% isn't going to make or break anything, but a lower fee is a lower fee.
Conclusion
VOO and VTI are highly correlated, as the former makes up about 82% of the latter by weight. Because of this, their historical performance has been very close, but we would expect VTI to slightly outperform VOO over the long term due to its inclusion of small- and mid-cap stocks, and indeed it has historically.
Conveniently, VTI can also be considered more diversified, as it holds about 3,000 more stocks than VOO. This contrasting number of holdings and subsequent cap size exposure is the primary difference between VOO and VTI.
The investor who for some reason is only seeking lower volatility large-cap stocks will want to go with VOO, tracking the S&P 500 Index. Those desiring greater diversification and greater expected returns, at the cost of slightly greater volatility, will want to go with VTI to capture the entire U.S. stock market. Alternatively, you might use VOO in combination with a small cap value fund; that's what I do in my own portfolio.
VTI's securities lending revenue will always offset more of its fee than VOO due to VTI holding small cap stocks. As a result, VTI's effective net cost is about 0.02%, with VOO at about 0.03%.
Both VOO and VTI are very tax-efficient, their dividend yield is basically the same, and they make a great pair for tax loss harvesting.
In any case, both VOO and VTI are solid choices to get broad exposure to the U.S. stock market. Some employer-sponsored retirement plans may only offer one of these funds and not the other. Keep in mind you may see their mutual fund equivalents, which are VFIAX for VOO and VTSAX for VTI.
Conveniently, all these funds should be available at any broker, including M1 Finance, which is the one I'm usually suggesting around here.
Canadians can find the above ETFs on Questrade or Interactive Brokers. Investors outside North America can use Interactive Brokers.
Disclosure: I am long VOO in my own portfolio.
Disclaimer: While I love diving into investing-related data and playing around with backtests, this is not financial advice, investing advice, or tax advice. The information on this website is for informational, educational, and entertainment purposes only. Investment products discussed (ETFs, mutual funds, etc.) are for illustrative purposes only. It is not a research report. It is not a recommendation to buy, sell, or otherwise transact in any of the products mentioned. I always attempt to ensure the accuracy of information presented but that accuracy cannot be guaranteed. Do your own due diligence. I mention M1 Finance a lot around here. M1 does not provide investment advice, and this is not an offer or solicitation of an offer, or advice to buy or sell any security, and you are encouraged to consult your personal investment, legal, and tax advisors. Hypothetical examples used, such as historical backtests, do not reflect any specific investments, are for illustrative purposes only, and should not be considered an offer to buy or sell any products. All investing involves risk, including the risk of losing the money you invest. Past performance does not guarantee future results. Opinions are my own and do not represent those of other parties mentioned. Read my lengthier disclaimer here.

Are you nearing or in retirement? Use my link here to get a free holistic financial plan and to take advantage of 25% exclusive savings on financial planning and wealth management services from fiduciary advisors at Retirable to manage your savings, spend smarter, and navigate key decisions.

Thank you very much for the good article.
One question.
Which ticker symbol you utilized when you compare VTI and VOO with PortfolioVisualizer.com?
For VTI and VOO, we can trace back from 2001 and 2010 respectively and for these specific ticker symbols, we are not able to confirm the before period.
Thank you very much,
Mutual funds or their underlying indexes.
Nice write-up. Quick question – I know you’re a fan of VOO (Vanguard S&P 500) for large-cap exposure especially when pairing with Small Cap Value exposure, any thoughts of using VV (Vanguard Largecap ETF) instead or no real reason to?
And I’m not even sure it even makes a real difference as the differences between the 2 are fairly razor thin. The only minor difference is that VV will hold all stocks in its largecap sized index set (currently has about 590 stocks) whereas the S&P 500 may exclude a few stocks. For example, Tesla was left out of the S&P 500 index for quite some time before the committee decided to include it.
But yeah VOO is super cheap and has the bigger name from tracking the well recognized S&P 500 index.
Bullet point three at the beginning – “VOO is entirely large-cap stocks” appears to be incorrect. Using morningstar.com, under “portfolio”, the style box (by weight), shows that VOO contains 16% midcap. It seems odd, in that the S&P 500 has a reported minimum market cap of 11.8 billion (https://www.spglobal.com/spdji/en/documents/additional-material/sp-500-brochure.pdf), and most define midcap as 2-10 billion. I discovered this when comparing RSP (an equal weight S&P fund) to VOO. According to Morningstar, RSP has 58% midcap, and 2% small cap! ETF.com confirms VOO’s inclusion of midcaps, and attributes it to the S&P 500 committee (https://www.etf.com/VOO#overview). NextAdvisor (https://time.com/nextadvisor/investing/sp-500-guide/) on 11/24/21 stated that the smallest stock in the S&P 500 is News Corporation Class B, with a market cap of 14.3 billion. Confusing, isn’t it!
Confusing indeed, Scott. Basically different definitions of cap sizes from different publications and indexes. It’s somewhat arbitrary.
Hi John. Thanks for your hard work.
I got a bit of a newbie question. You wrote above that “VTI is comprised of roughly 82% large-cap, 12% mid-cap, and 6% small-cap stocks.” But Fidelity lists VTI as 72.4% large-cap, 19.12% mid-cap, 6.21% small-cap, 2.27% micro-cap. https://screener.fidelity.com/ftgw/etf/goto/snapshot/portfolioComposition.jhtml?symbols=VTI
Why is there such a big difference between the numbers for large and mid cap? I ask because I’m trying recreate a total market index fund at my 401K. I looked up VTI on fidelity before remembering you recently wrote this article.
Thanks for your help and insight.
Just depends on where they put the dividers for defining the different cap sizes based on market cap. The S&P 500 is about 82% of VTI, and we refer to the S&P 500 colloquially as “large caps,” but technically you could argue some of them at the bottom are mid-caps. This page might help.
In any case, I wouldn’t worry about it too much.
Is vti on fidelity ?
Yes