JPST, NEAR, and MINT are three very popular and similar actively managed short maturity bond ETFs designed for current income. I compare them here.
Disclosure: Some of the links on this page are referral links. At no additional cost to you, if you choose to make a purchase or sign up for a service after clicking through those links, I may receive a small commission. This allows me to continue producing high-quality content on this site and pays for the occasional cup of coffee. I have first-hand experience with every product or service I recommend, and I recommend them because I genuinely believe they are useful, not because of the commission I may get. Read more here.
Contents
Video
Prefer video? Watch it here:

JPST vs. NEAR vs. MINT – Methodologies, Yields, and Fees
JPST is the JPMorgan Ultra-Short Income ETF. It launched in 2017 and has since become the most popular actively managed ETF in the world with nearly $25 billion in assets. JPST has about 600 holdings.
NEAR is the BlackRock Short Maturity Bond ETF. It launched in 2013 and has about $4 billion in assets. NEAR has 362 holdings.
MINT is the PIMCO Enhanced Short Maturity Active ETF. It launched in 2009 and has about $9 billion in assets. Like JPST, MINT has roughly 600 holdings.
Their sector compositions differ, but all three of these funds do more or less the same thing, with varying degrees of success. They all aim to provide low volatility and current income by actively selecting a diversified basket of short-term investment-grade debt instruments from around the world, such as corporate bonds, U.S. Treasury notes, agency-backed securities, mortgage-related debt, and more.
At the time of writing, the 30-day SEC Yields of JPST, NEAR, and MINT are all very close at 5.47%, 5.78%, and 5.54% respectively, with respective expense ratios of 0.18%, 0.25%, and 0.35%.
JPST vs. NEAR vs. MINT – Performance
Performance is obviously what most people are concerned with in this context. Here's how JPST, NEAR, and MINT have fared compared to cash (T-bills) since JPST's inception in 2017 and looking through October 2023:
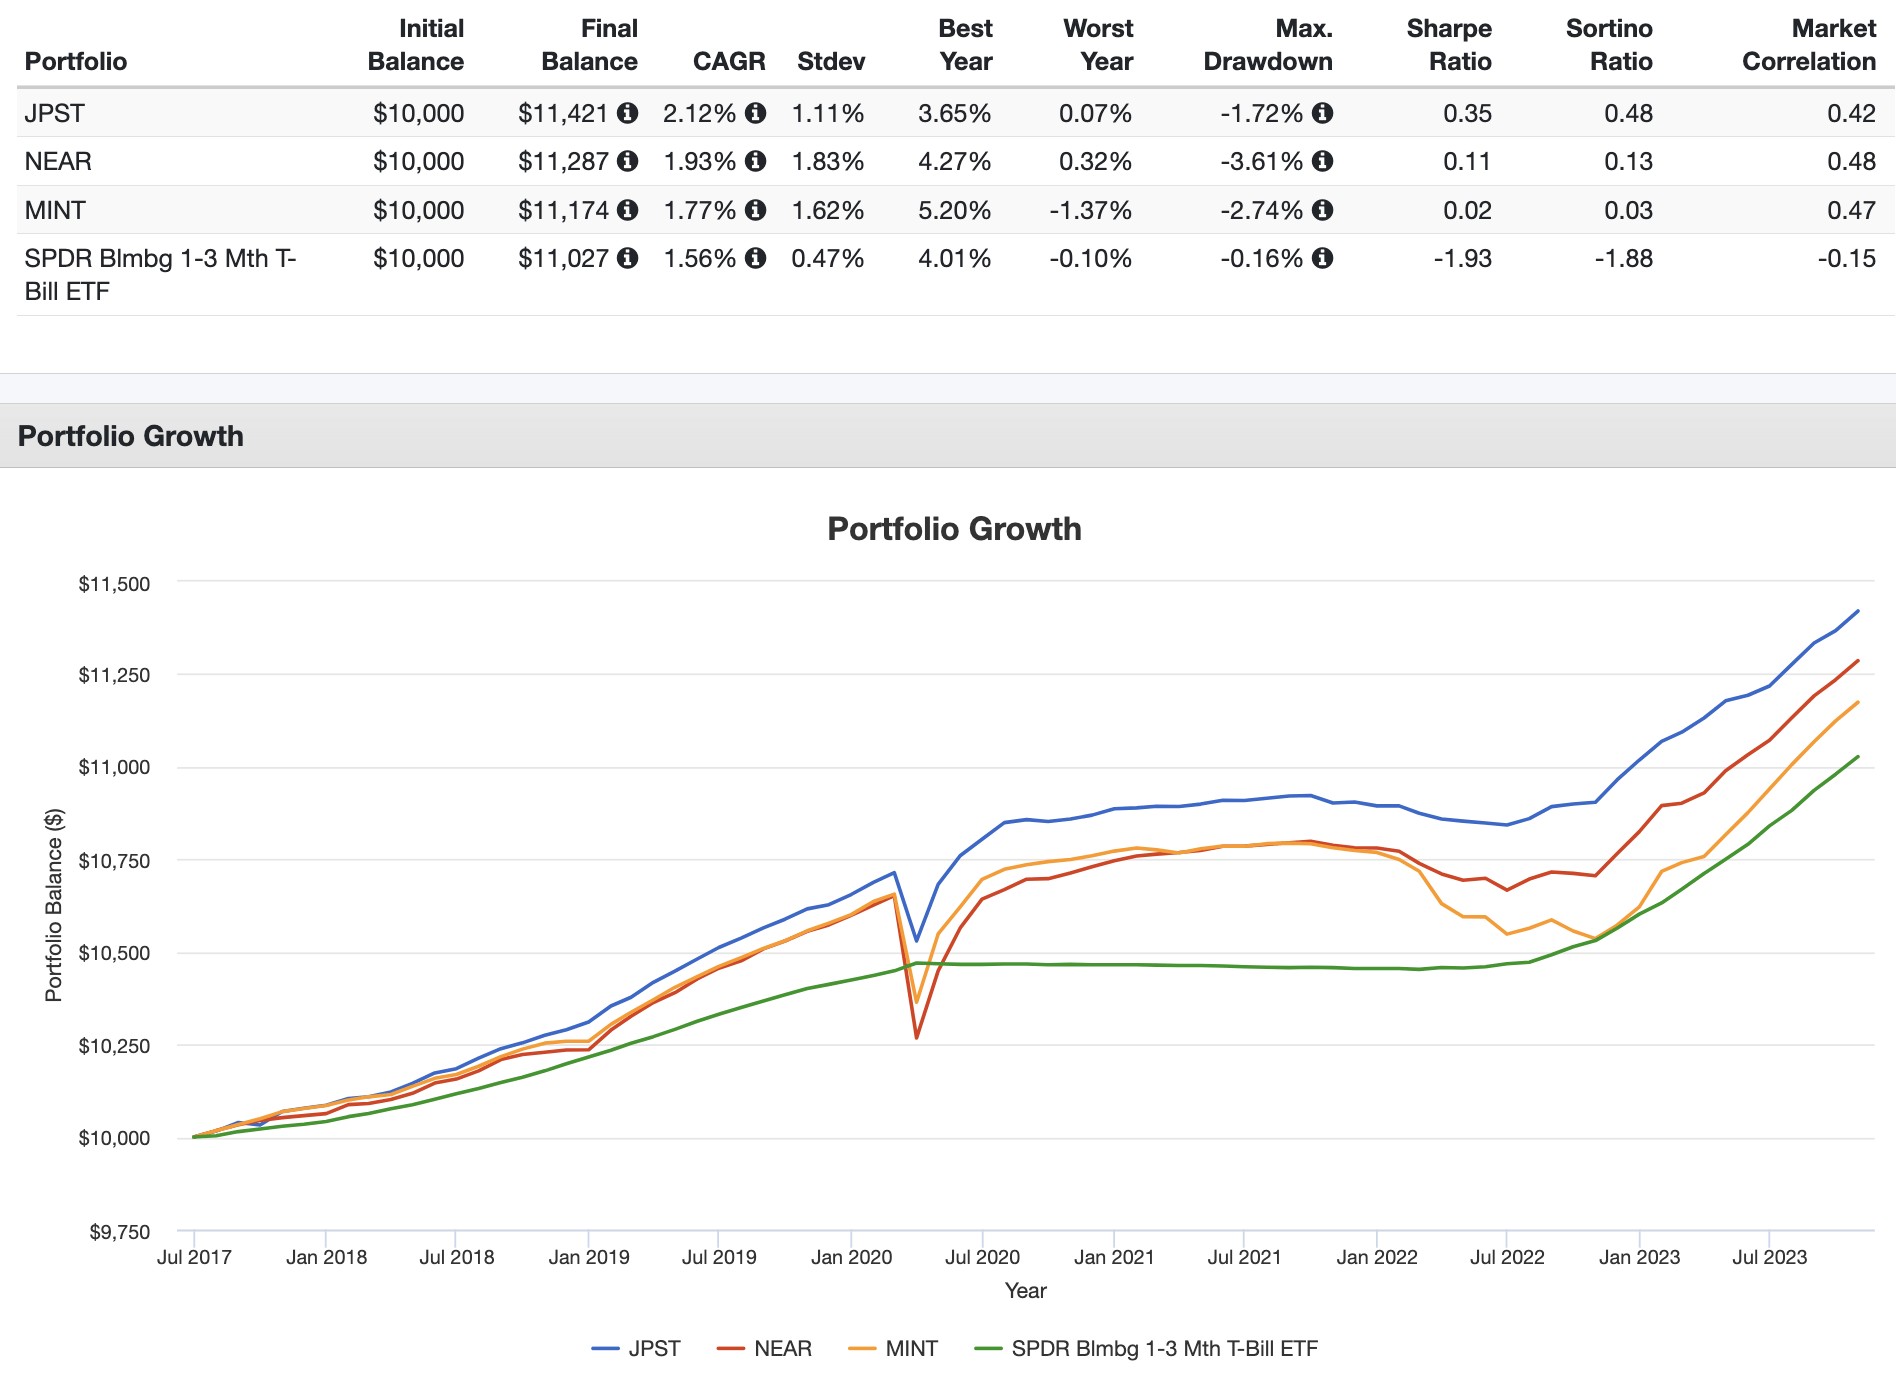
Notice how JPST has beaten the other two on basically every metric – higher general and risk-adjusted returns and the lowest volatility and smallest max drawdown.
But also notice how all 3 of these funds are pretty exposed to equities risk and thus dropped substantially in the March 2020 flash crash and additionally had a pretty rocky year for 2022, while T-bills easily weathered those storms unscathed. That's the irony with income funds such as these – they typically aren't reliable at the precise times when you may need that income the most.
Conclusion
Even though the timeline is relatively short, JPST has proven its ability and has smoked its competitors. Thus, it makes sense that it has become the most popular actively managed fund in the world even though it's the youngest of these three.
Conveniently, it also happens to be the cheapest on the list with a fee of 0.18%.
JPST should be available at any major broker, including M1 Finance, which is the one I'm usually suggesting around here.
What do you think of these three funds? Do you own any of them? Let me know in the comments.
Disclosure: None.
Disclaimer: While I love diving into investing-related data and playing around with backtests, this is not financial advice, investing advice, or tax advice. The information on this website is for informational, educational, and entertainment purposes only. Investment products discussed (ETFs, mutual funds, etc.) are for illustrative purposes only. It is not a research report. It is not a recommendation to buy, sell, or otherwise transact in any of the products mentioned. I always attempt to ensure the accuracy of information presented but that accuracy cannot be guaranteed. Do your own due diligence. I mention M1 Finance a lot around here. M1 does not provide investment advice, and this is not an offer or solicitation of an offer, or advice to buy or sell any security, and you are encouraged to consult your personal investment, legal, and tax advisors. Hypothetical examples used, such as historical backtests, do not reflect any specific investments, are for illustrative purposes only, and should not be considered an offer to buy or sell any products. All investing involves risk, including the risk of losing the money you invest. Past performance does not guarantee future results. Opinions are my own and do not represent those of other parties mentioned. Read my lengthier disclaimer here.

Are you nearing or in retirement? Use my link here to get a free holistic financial plan and to take advantage of 25% exclusive savings on financial planning and wealth management services from fiduciary advisors at Retirable to manage your savings, spend smarter, and navigate key decisions.

Leave a Reply