• Skip to main content
  • Skip to secondary menu
  • Skip to primary sidebar
  • Skip to footer

Optimized Portfolio

Investing and Personal Finance

  • Start Here
  • Investing 101
    • Beginners Start Here – 10 Steps To Start Building Wealth
    • What Is the Stock Market? How It Works & How to Invest in It
    • How To Invest in an Index Fund – The Best Index Funds
    • Portfolio Asset Allocation by Age
    • How To Invest Your Emergency Fund
    • Portfolio Diversification – How To Diversify Your Portfolio
    • Dollar Cost Averaging vs. Lump Sum Investing (DCA vs. LSI)
    • How To Invest Your HSA (Health Savings Account)
    • Factor Investing and Factor ETFs – The Ultimate Guide
    • more…
  • Lazy Portfolios
    • All Weather Portfolio
    • Bogleheads 3 Fund Portfolio
    • HEDGEFUNDIE’s Excellent Adventure
    • Warren Buffett Portfolio
    • Golden Butterfly Portfolio
    • Paul Merriman Ultimate Buy and Hold Portfolio
    • Ben Felix Model Portfolio
    • Permanent Portfolio
    • David Swensen Portfolio
    • 60/40 Portfolio
    • more…
  • Funds
    • VOO vs. VTI – Vanguard S&P 500 or Total Stock Market ETF?
    • The 7 Best International ETFs
    • The 8 Best Small Cap ETFs (4 From Vanguard)
    • The 5 Best REIT ETFs
    • The 5 Best EV ETFs – Electric Vehicles ETFs
    • VIG vs. VYM – Comparing Vanguard’s 2 Popular Dividend ETF’s
    • The Best Vanguard Dividend Funds – 4 Popular ETFs
    • The 5 Best Tech ETFs
    • The 7 Best Small Cap Value ETFs
    • The 6 Best ETFs for Taxable Accounts
    • The 5 Best Emerging Markets ETFs (1 From Vanguard) for 2023
    • more…
  • Leverage
    • What Is a Leveraged ETF and How Do They Work?
    • How To Beat the Market Using Leverage and Index Investing
    • The 9 Best Leveraged ETFs
    • Hedgefundie’s Excellent Adventure
    • Leveraged All Weather Portfolio
    • Leveraged Permanent Portfolio
    • Leveraged Golden Butterfly Portfolio
    • NTSX – Review and Summary
    • TQQQ – Is It A Good Investment?
    • PSLDX – A Review
    • SWAN – A Review
    • RPAR Risk Parity ETF Review
    • more…
  • Dividends
    • The Best M1 Finance Dividend Pie
    • The 11 Best Dividend ETFs
    • The Best Vanguard Dividend Funds – 4 Popular ETFs
    • VIG vs. VYM – Comparing Vanguard’s 2 Popular Dividend ETF’s
    • 8 Reasons Why I’m Not a Dividend Income Investor
    • QYLD – A Harsh Review
    • more…
  • Brokers
    • The 5 Best Stock Brokers
    • The 4 Best Investing Apps
    • M1 Finance Review
    • Brokers with the Lowest Margin Rates
    • M1 Finance vs. Fidelity
    • M1 Finance vs. Vanguard
    • Webull vs. Robinhood
    • Stash vs. Robinhood
    • M1 Borrow Review (How M1’s Margin Loan Works)
    • more…
  • Retirement
    • The 10 Best ETFs for Retirement Portfolios in 2023
    • The 4% Rule for Retirement Withdrawal Rate – A Revisitation
    • Sequence of Return Risk in Retirement Explained
    • Traditional IRA Explained
    • Roth IRA Explained
    • 401k vs. Roth IRA
    • Roth IRA vs. Traditional IRA
    • Backdoor Roth IRA Explained
    • more…
  • My Toolbox

Pinwheel Portfolio Review and ETF Pie for M1 Finance

Last Updated: August 8, 2022 6 Comments – 2 min. read

The Pinwheel Portfolio utilizes “colorful diversification and familiar symmetry.” Here we’ll take a look at its components, performance, and the best ETF’s to use in its execution.

Interested in more Lazy Portfolios? See the full list here.

Disclosure:  Some of the links on this page are referral links. At no additional cost to you, if you choose to make a purchase or sign up for a service after clicking through those links, I may receive a small commission. This allows me to continue producing high-quality, ad-free content on this site and pays for the occasional cup of coffee. I have first-hand experience with every product or service I recommend, and I recommend them because I genuinely believe they are useful, not because of the commission I get if you decide to purchase through my links. Read more here.

Contents

  • What is the Pinwheel Portfolio?
  • Pinwheel Portfolio Performance Backtest vs. the S&P 500
  • Pinwheel Portfolio ETF Pie for M1 Finance

What is the Pinwheel Portfolio?

The Pinwheel Portfolio is a lazy portfolio created by Tyler from PortfolioCharts.com. He named it such because of its “colorful diversification and familiar symmetry.” He also designed the Golden Butterfly Portfolio. The Pinwheel Portfolio is probably the most visually appealing lazy portfolio.

The Pinwheel Portfolio was designed to span all 4 core assets: U.S. stocks, international stocks, bonds, and real assets. This maximizes diversification similarly to the David Swensen Portfolio.

Essentially, the Pinwheel Portfolio uses equal weightings of the 4 assets above, and then overweights (“tilts”) specific asset classes within each one in an attempt to optimize performance (greater expected returns) and reduce volatility and risk. These specific market segments have historically paid a risk premium.

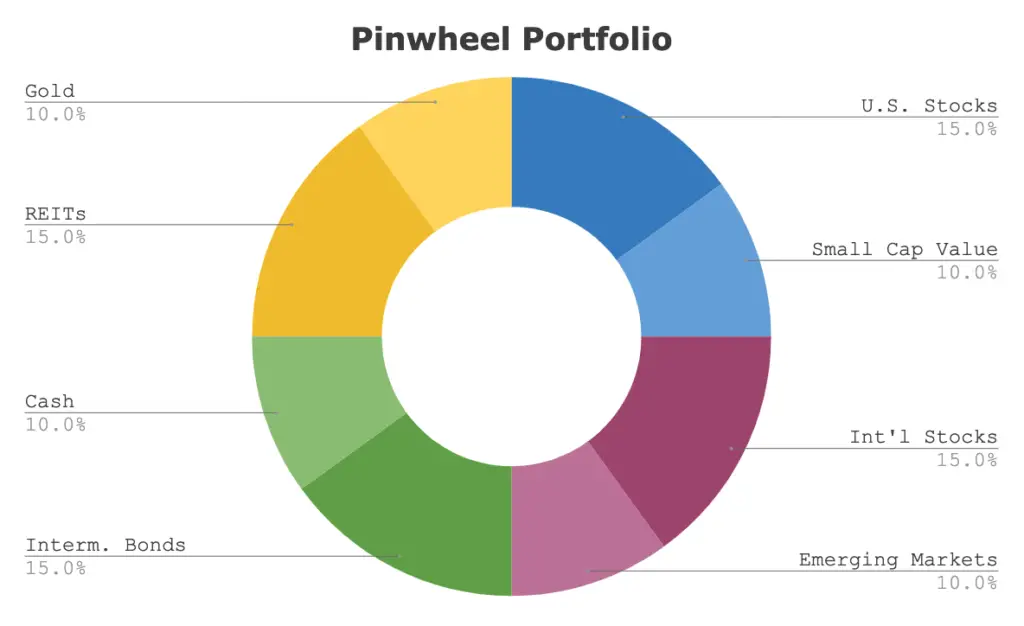
The Pinwheel Portfolio is as follows:

  • 15% Total U.S. Stock Market
  • 10% U.S. Small Cap Value
  • 15% Total International Stock Market
  • 10% Emerging Markets
  • 15% Intermediate Bonds
  • 10% Cash
  • 15% REITs
  • 10% Gold
pinwheel portfolio

Pinwheel Portfolio Performance Backtest vs. the S&P 500

Going back to 1995, here’s the Pinwheel Portfolio’s performance vs. an S&P 500 index fund through 2019:

pinwheel portfolio performance vs s&p 500
Portfolio 1 = Blue = PP. Red = S&P 500. Source: PortfolioVisualizer.com

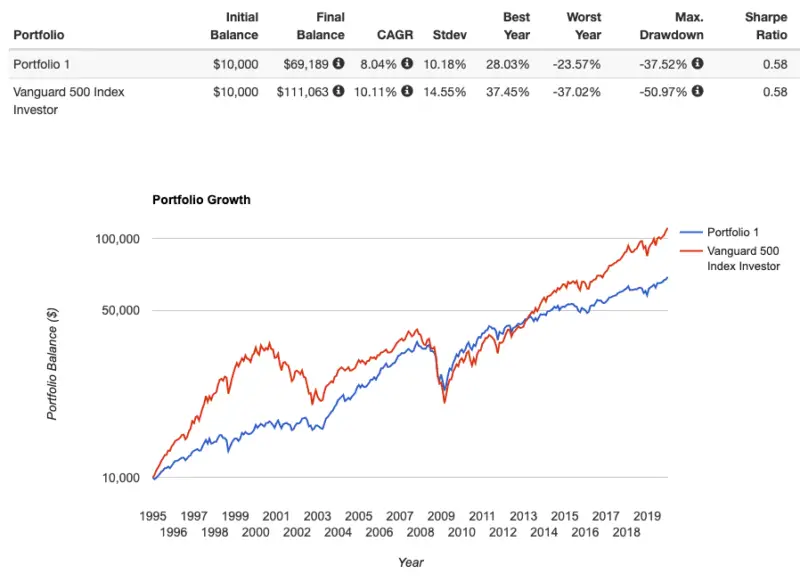
Compared to the S&P 500 index, the Pinwheel Portfolio has delivered an identical risk-adjusted return (Sharpe) since 1995, with lower volatility, as we’d expect.

I appreciate the Pinwheel’s Portfolio’s use of international diversification (most lazy portfolios don’t) and the small cap value tilt to capture the Size and Value factor premia. I still think they exist, though they’ve suffered in recent years.

I also agree with Tyler that while many, myself included, aren’t into gold, a 10% allocation is a much easier pill to swallow than 20-25% as with the Permanent Portfolio. The bonds, gold, and REITs act as diversifiers to help lower portfolio volatility and risk, providing a smoother, more stable ride as you can see in the graph above.

With the 10% allocation to cash, I’d probably be inclined to put the other 15% fixed income in long-term bonds instead of intermediate-term bonds, thereby basically getting a barbell approach on the 1/4 fixed income slice.

Pinwheel Portfolio ETF Pie for M1 Finance

M1 Finance is a great choice of broker to implement the Pinwheel Portfolio because it makes regular rebalancing seamless and easy, has zero transaction fees, and incorporates dynamic rebalancing for new deposits. I wrote a comprehensive review of M1 Finance here.

Using almost entirely low-cost Vanguard funds, we can construct the Pinwheel Portfolio pie like this:

  • VTI – 15%
  • VIOV – 10%
  • VXUS – 15%
  • VWO – 10%
  • VGIT – 15%
  • VGSH – 10%
  • VNQ – 15%
  • SGOL – 10%

You can add the Pinwheel Portfolio pie to your portfolio on M1 Finance by clicking this link and then clicking “Save to my account.”


Don’t want to do all this investing stuff yourself or feel overwhelmed? Check out my flat-fee-only fiduciary friends over at Advisor.com.

Disclosure: I am long VWO in my own portfolio.

Interested in more Lazy Portfolios? See the full list here.

Disclaimer:  While I love diving into investing-related data and playing around with backtests, I am in no way a certified expert. I have no formal financial education. I am not a financial advisor, portfolio manager, or accountant. This is not financial advice, investing advice, or tax advice. The information on this website is for informational and recreational purposes only. Investment products discussed (ETFs, mutual funds, etc.) are for illustrative purposes only. It is not a recommendation to buy, sell, or otherwise transact in any of the products mentioned. Do your own due diligence. Past performance does not guarantee future returns. Read my lengthier disclaimer here.

m1

Don't want to do all this investing stuff yourself or feel overwhelmed? Check out my flat-fee-only fiduciary friends over at Advisor.com.

77 percent of millenials report their finances are a source of anxiety

Related Posts

  • The 7 Best Value ETFs To Buy Value Stocks in 2023
  • AOR ETF Review – iShares Core Growth Allocation ETF (60/40)
  • Roger Gibson 5 Asset Portfolio Review and M1 Finance ETF Pie
  • Jack Bogle Was Wrong About These 3 Things
  • VOO vs. VOOV vs. VOOG – Vanguard S&P 500, Value, or Growth?

About John Williamson

Analytical and entrepreneurial-minded data nerd, usability enthusiast, Boglehead, and Oxford comma advocate. I lead the Paid Search marketing efforts at Gild Group. I'm not a big fan of social media, but you can find me on LinkedIn and Reddit.

Reader Interactions

Comments

  1. Erik says

    June 23, 2021 at 2:27 pm

    Any particular reason for VBR instead of something like VIOV? As you point-out in a different article VBR is more of a blend; it’s actually a small/mid index rather than a true small-cap index.

    Reply
    • John Williamson says

      June 23, 2021 at 3:32 pm

      Sorry about that. Just hadn’t gotten around to swapping it out yet! I’ll try to get to that tonight if I remember.

      Reply
    • John Williamson says

      June 24, 2021 at 2:20 pm

      Got it updated!

      Reply
  2. SenorB says

    December 9, 2020 at 1:32 am

    John,

    I’m really learning a lot from reading your analysis of each lazy portfolio.

    I noticed that the max drawdown for the Pinwheel Portfolio shown here (37.52%) differs substantially from the max drawdown shown on the Portfoliocharts website (26%).

    This discrepancy exists for some other portfolios as well. For Golden Butterfly, you show a max drawdown of 16.64%. Portfoliocharts shows 11%. For most of the other portfolios I checked, the max drawdowns were within 1 or 2 percentage points. However, the discrepancy with the Pinwheel Portfolio really stood out to me.

    My understanding is that there might be small differences due to the data set used or the calculation method or the years examined, but I wouldn’t think these factors would result in such a big delta as seen in the Pinwheel Portfolio. Is there another factor that might explain this? I’d also be interested in knowing your take on methodology and how using different methods and data sets produce different results (maybe a good blog post?).

    Thanks.

    Reply
    • John Williamson says

      December 11, 2020 at 10:37 pm

      Sorry for the late reply; your comments initially got flagged as spam.

      Glad you’re enjoying the content!

      I looked into this briefly and I’m honestly not sure why these differences in drawdown metrics are happening between the 2 sites. You’re right; they definitely should not differ that much. Unfortunately on PortfolioCharts it doesn’t show the year that drawdown occurred so I can’t even really attempt to match them up.

      I suspect this is why, from Portfolio Charts:

      One should note that the deepest drawdown number is based solely on year-end returns. It’s absolutely possible that a portfolio experienced something even worse than that in the middle of a year.

      Sounds like what PC is calling the “max drawdown” may actually be the “Worst Year” stat reported by PV. The “even worse than that in the middle of the year” is what PV is reporting on.

      In any case, I’d be more likely to trust PV’s metrics.

      Reply
      • SenorB says

        December 14, 2020 at 10:53 am

        I see, thanks.

        Reply

Leave a Reply Cancel reply

Your email address will not be published. Required fields are marked *

Primary Sidebar

  • Facebook
  • Instagram
  • Reddit
  • Twitter
  • YouTube
  • Patreon

Email Newsletter

Sign up to receive email updates when a new post is published.

Don't worry, I hate spam too. No ads.

Most Popular

Ray Dalio All Weather Portfolio Review, ETFs, & Leverage (2023)

HEDGEFUNDIE’s Excellent Adventure (UPRO/TMF) – A Summary

Golden Butterfly Portfolio Review and M1 Finance ETF Pie

David Swensen Portfolio (Yale Model) Review and ETFs To Use

Harry Browne Permanent Portfolio Review, ETFs, & Leverage (2023)

Corporate Bonds vs. Government Bonds (Treasuries) – The Showdown

VIG vs. VYM – Vanguard’s 2 Popular Dividend ETFs (Review)

Warren Buffett ETF Portfolio (90/10) Review and ETFs (2023)

The 60/40 Portfolio Review and ETF Pie for M1 Finance

Bogleheads 3 Fund Portfolio Review and Vanguard ETFs (2023)

m1 sidebar

rocket money

m1 sidebar

visor sidebar

retirable

Paul Merriman Ultimate Buy and Hold Portfolio Review, M1 Pie (2023)

Lowest Margin Rates Brokers (2023 Comparison)

M1 Finance vs. Vanguard Brokerage Comparison [2023 Review]

M1 Finance vs. Fidelity Brokerage Comparison [2023 Review]

The Best M1 Finance Dividend Pie for FIRE & Income Investors

Portfolio Asset Allocation by Age – Beginners To Retirees

The 5 Best Stock Brokers Online for Investing (2023 Review)

The 4 Best Investing Apps for Beginners (2023 Review)

The 7 Best Small Cap ETFs (3 From Vanguard) for 2023

The 6 Best REIT ETFs To Invest in Real Estate for 2023

The 6 Best Tech ETFs To Buy Tech Stocks in 2023

9 Best Clean Energy ETFs To Go Green in Your Portfolio (2023)

The 13 Best Small Cap Value ETFs (3 From Vanguard) for 2023

Why, How, & Where To Invest Your Emergency Fund To Beat Inflation

VOO vs. VTI – Vanguard’s S&P 500 and Total Stock Market ETFs

9 Best International ETFs To Buy (6 From Vanguard) in 2023

Ben Felix Model Portfolio (Rational Reminder, PWL) ETFs & Review

Factor Investing and Factor ETFs – The Ultimate Guide

Gone Fishin’ Portfolio Review (Alexander Green) & ETFs (2023)

TQQQ – Is It A Good Investment for a Long Term Hold Strategy?

Recent Posts

Roth IRA vs. Traditional IRA – Which Is Better for You? (2023)

VXUS vs. IXUS – Vanguard or iShares International ETF?

Tail Risk – What It Is and How To Hedge Against It

I Bonds Explained (US Savings Bonds) – Ultimate Guide (2023)

JEPI ETF Review – JPMorgan Equity Premium Income ETF

Sharpe Ratio vs. Sortino vs. Calmar – Risk Adjusted Return

Portfolio Risk Explained – How To Think About Risk and Volatility

HNDL ETF Review – Is HNDL a Good Investment? (7HANDL™ ETF)

NUSI ETF Review – Is NUSI a Good Investment?

3 Best SPAC ETFs To Invest in SPACs in 2023 – But Should You?

VOO vs. VOOV vs. VOOG – Vanguard S&P 500, Value, or Growth?

VXUS vs. VEU – Which Vanguard Total International ETF?

VT vs. VTI – Global Stock Market vs. Total U.S. Stock Market

RPAR Risk Parity ETF Review – An All Weather Portfolio ETF?

PSLDX – A Review of the PIMCO StocksPLUS® Long Duration Fund

View All...

Footer

  • Facebook
  • Instagram
  • Reddit
  • Twitter
  • YouTube
  • Patreon

Amazon Affiliate Disclosure

OptimizedPortfolio.com is a participant in the Amazon Services LLC Associates Program, an affiliate advertising program designed to provide a means for sites to earn advertising fees by advertising and linking to Amazon.com.

Email Newsletter

Sign up to receive email updates when a new post is published.

Don't worry, I hate spam too. No ads.

About - My Toolbox - Privacy - Terms - Contact


Copyright © 2023 OptimizedPortfolio.com

This website uses cookies to improve your experience. We'll assume you're ok with this, but you can opt-out if you wish. Ok, Got ItReject Read More
Privacy & Cookies Policy

Privacy Overview

This website uses cookies to improve your experience while you navigate through the website. Out of these, the cookies that are categorized as necessary are stored on your browser as they are essential for the working of basic functionalities of the website. We also use third-party cookies that help us analyze and understand how you use this website. These cookies will be stored in your browser only with your consent. You also have the option to opt-out of these cookies. But opting out of some of these cookies may affect your browsing experience.
Necessary
Always Enabled
Necessary cookies are absolutely essential for the website to function properly. This category only includes cookies that ensures basic functionalities and security features of the website. These cookies do not store any personal information.
Non-necessary
Any cookies that may not be particularly necessary for the website to function and is used specifically to collect user personal data via analytics, ads, other embedded contents are termed as non-necessary cookies. It is mandatory to procure user consent prior to running these cookies on your website.
SAVE & ACCEPT