SCHD is a popular dividend ETF from Schwab to capture profitable U.S. stocks with a sustainable dividend. But is it a good investment? I review it here.
First, note that I don't chase dividends. But I recognize that many investors use dividends to supplement their current income, particularly in retirement. Others just irrationally prefer dividend-paying stocks. I even designed a dividend-focused portfolio for income investors that uses SCHD as its primary holding; I'll explain why below.
Disclosure: Some of the links on this page are referral links. At no additional cost to you, if you choose to make a purchase or sign up for a service after clicking through those links, I may receive a small commission. This allows me to continue producing high-quality content on this site and pays for the occasional cup of coffee. I have first-hand experience with every product or service I recommend, and I recommend them because I genuinely believe they are useful, not because of the commission I may get. Read more here.
Contents
SCHD Review Video
Prefer video? Watch it here:

SCHD Methodology, Dividend Yield, and Fees
SCHD is the Schwab U.S. Dividend Equity ETF. The fund is a very popular dividend ETF from Schwab that launched in late 2011. Since then, the fund has amassed over $35 billion in assets.
SCHD has a little over 100 holdings and aims to capture companies with a reliable dividend history and robust profitability. Its market cap weighted index is the Dow Jones U.S. Dividend 100 Index. SCHD can be described as a large cap value fund. On average, larger stocks are more stable, are less risky, and have more predictable cash flow than smaller stocks. Value stocks have also outperformed growth stocks historically due to what we believe is a risk premium.
Though it may appear so at first glance, SCHD is not just your typical, simple dividend fund. It first looks for companies with 10 years of consecutive dividend payment history and a minimum market cap of $500 million. SCHD then employs fundamental earnings screens like return on equity, dividend growth rate, and debt to equity ratios to attempt to capture high-quality companies with strong profitability that can pay a sustainable dividend going forward.
Individual holdings are capped at 4%, and sectors at 25%. Also note that SCHD excludes REITs entirely.
At the time of writing, SCHD has a dividend yield of 3.03% and a fee of 0.06%.
SCHD Sector Composition
For being a large cap dividend fund, SCHD is pretty well diversified across sectors aside from a negligible weight to Utilities and its excluding REITs entirely. But the fund naturally tilts toward some traditionally “defensive” sectors like Consumer Staples and Industrials.
| Sector | Weight |
|---|---|
| Basic Materials | 2.8% |
| Consumer Staples | 14.7% |
| Consumer Discretionary | 7.5% |
| Financials | 19.6% |
| Healthcare | 13.1% |
| Industrials | 15.8% |
| Energy | 5.9% |
| Technology | 14.9% |
| Telecommmunications | 5.4% |
| Utilities | 0.4% |
| Real Estate | 0.0% |
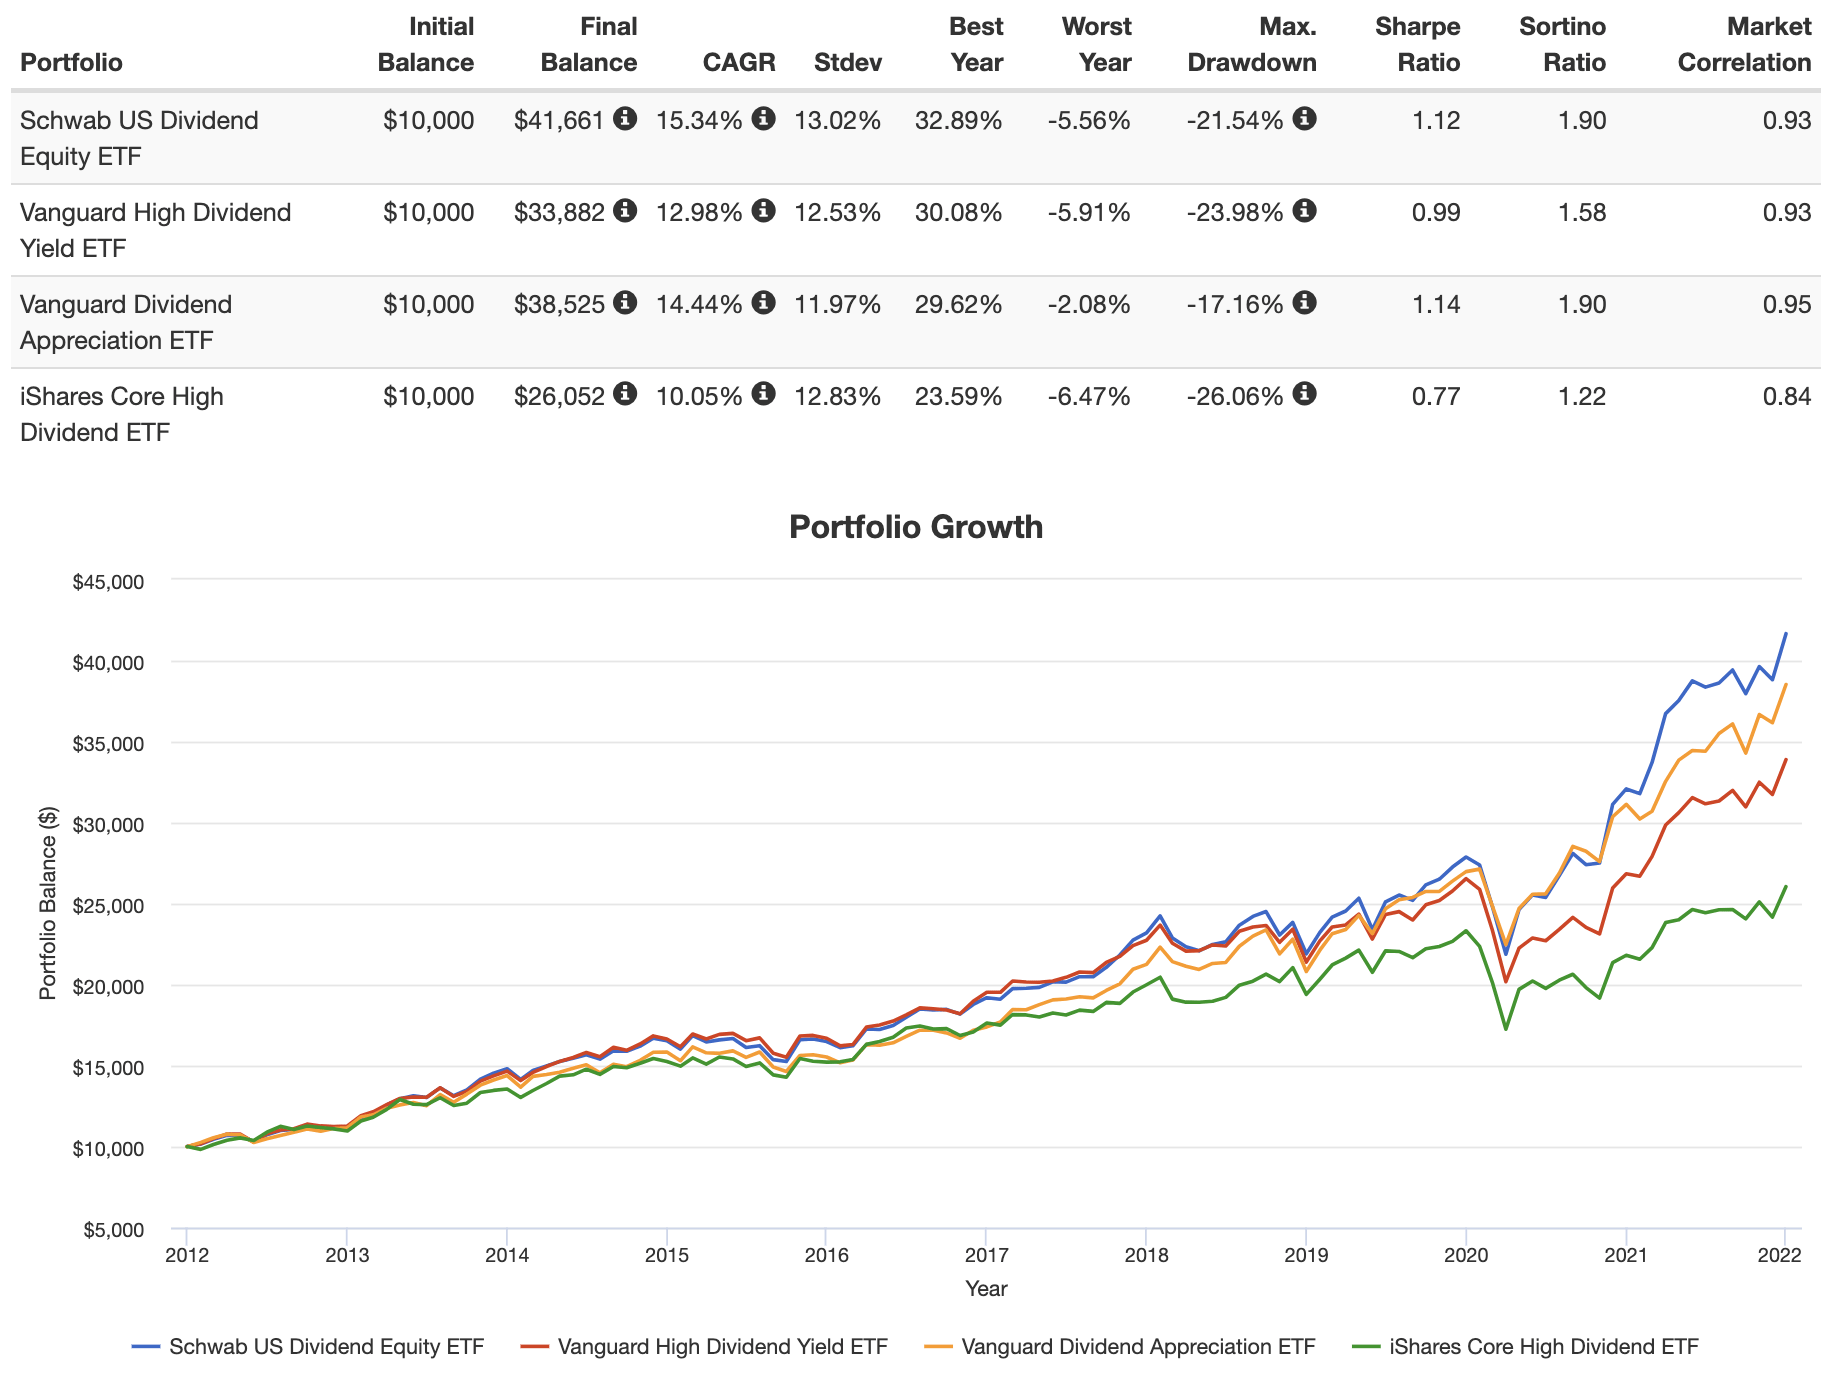
SCHD Performance
Going back to 2011 when SCHD launched and looking through 2021, it has outperformed its closest peers VYM, VIG, and HDV on both a general and risk-adjusted basis:
Is SCHD a Good Investment?
So is SCHD a good investment? Maybe.
SCHD delivers appreciable exposure to equity risk factors like Profitability and Investment, as well as non-trivial exposure to the Value factor. These are independent sources of risk that explain the differences in returns between diversified portfolios. I delved into factors in a separate post here. As I've noted elsewhere, the historical success of dividend investing as a whole is largely rooted in these factor premia.
Essentially, SCHD is a pretty decent factor fund that's not really a factor fund and, in my opinion, is a strong contender for the best dividend fund out there. That's why I made it the primary holding in the dividend portfolio I designed for income investors.
SCHD also happens to be one of the cheapest dividend funds out there with a fee of only 0.06%.
As I hinted at earlier, this certainly isn't the highest yielding fund out there, but it should be one of the more stable, reliable ones.
Conveniently, SCHD should be available at any major broker, including M1 Finance, which is the one I'm usually suggesting around here.
What do you think of SCHD? Let me know in the comments.
Disclaimer: While I love diving into investing-related data and playing around with backtests, this is not financial advice, investing advice, or tax advice. The information on this website is for informational, educational, and entertainment purposes only. Investment products discussed (ETFs, mutual funds, etc.) are for illustrative purposes only. It is not a research report. It is not a recommendation to buy, sell, or otherwise transact in any of the products mentioned. I always attempt to ensure the accuracy of information presented but that accuracy cannot be guaranteed. Do your own due diligence. I mention M1 Finance a lot around here. M1 does not provide investment advice, and this is not an offer or solicitation of an offer, or advice to buy or sell any security, and you are encouraged to consult your personal investment, legal, and tax advisors. Hypothetical examples used, such as historical backtests, do not reflect any specific investments, are for illustrative purposes only, and should not be considered an offer to buy or sell any products. All investing involves risk, including the risk of losing the money you invest. Past performance does not guarantee future results. Opinions are my own and do not represent those of other parties mentioned. Read my lengthier disclaimer here.

Are you nearing or in retirement? Use my link here to get a free holistic financial plan and to take advantage of 25% exclusive savings on financial planning and wealth management services from fiduciary advisors at Retirable to manage your savings, spend smarter, and navigate key decisions.

Leave a Reply