Tail risk refers to the probability of an extreme outcome from a rare event. Here we'll look at what it is, how it affects portfolio construction, and hedging strategies for it.
Disclosure: Some of the links on this page are referral links. At no additional cost to you, if you choose to make a purchase or sign up for a service after clicking through those links, I may receive a small commission. This allows me to continue producing high-quality content on this site and pays for the occasional cup of coffee. I have first-hand experience with every product or service I recommend, and I recommend them because I genuinely believe they are useful, not because of the commission I may get. Read more here.
Contents
Introduction – What Is Tail Risk?
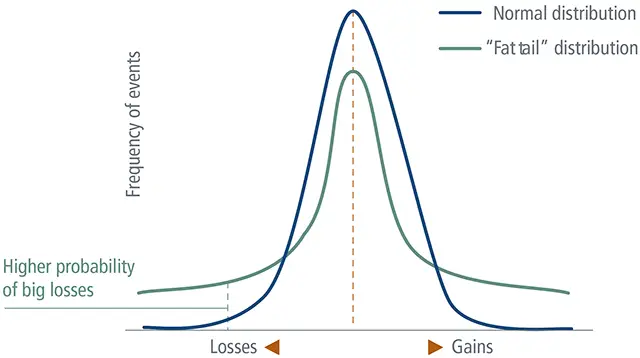
Tail risk describes the likelihood of rare events at the ends of a probability distribution. Specifically, greater tail risk would suggest that the probability of a rare event is greater than what a normal distribution would indicate. We call this having “fat tails.” It has been shown empirically that asset returns do indeed tend to exhibit fatter tails than what a perfect bell curve would predict.
In the middle of the bell curve is the expected value, or in investing terms, the average expected return for an investment (or for a portfolio). On either end of the distribution are the rare but extreme outcomes (“returns”). Of course, we can have a “fat tail” on both sides of the distribution for negative and positive outcomes (think major losses and major gains, respectively), but obviously we typically only really care about preparing for and diversifying against the former, similar to how I mentioned using risk-adjusted return ratios that only look at downside risk like Sortino and Calmar rather than Sharpe. I've also mentioned that these sorts of rare adverse events are known as black swans.

Thus, an ideal portfolio seeks to reduce the left tail to mitigate extreme losses while not altering the right tail in order to avoid hindering outsized gains. In reality, this is usually impossible and the closest thing we can get to that free lunch is, as I've said many times, broad diversification.
Humans tend to underestimate the likelihood of adverse events. This is called optimism bias. Put another way, investors tend to ignore or underestimate tail risk. This is especially true of young investors who started in the past decade.
As you can imagine, tail risk is an important consideration for the investor with a short time horizon who needs liquidity, for the retiree whose annual portfolio withdrawals are not being replenished (see sequence risk), and for the risk-averse investor who would be inclined to sell in a panic during a significant market crash like we saw in 2008. Severe market shocks can be catastrophic for these investors.
Measuring Tail Risk
It's hard to measure tail risk reliably because black swan events are by definition unpredictable, infrequent, and variable in their degree of detrimental effect. The insurance industry uses value-at-risk ratios (I touched on those briefly here) to measure tail risk in more predictable environments.
Kurtosis is a metric used to measure the extreme values of tail events, but of course we can only observe this ex post. That said, measuring the kurtosis of a portfolio may at least give us some idea of its future tail risk relative to another. A distribution with fatter-than-normal tails is said to be leptokurtic or having excess kurtosis.
Skewness is a measure of the asymmetry of tail risk. A distribution with a larger left tail is said to have negative skewness. A distribution with a larger right tail is said to have positive skewness. Naturally, investors prefer assets and strategies with positive skewness.
Now let's explore some tail risk hedging strategies.
Tail Risk Hedging Strategies – Ideas, Assets, ETFs, etc.
As I hinted at earlier, I would submit that one's time horizon should probably be inversely correlated to how much time and effort – and allocation – the investor puts into a tail risk hedging strategy in their investment portfolio. This is because, on average, all else equal, we would usually expect to sacrifice some total return in doing so, at least in the short term.
The first obvious line of defense in your tail risk hedging efforts should be diversification. It's the closest thing we've got to a free lunch in investing. I won't go into too much detail here, but I discussed the why and how of portfolio diversification in a separate post here. In short, assuming the young accumulator is using stocks as the basis of the portfolio, this would mean investing globally across all cap sizes, styles, and equity risk factors.
Expanding out from there, we can entertain diversifying across other assets like treasury bonds and gold. Treasuries tend to exhibit “crisis alpha” when people flock to their safety during market crashes, and they have had a moderate negative correlation to stocks on average. TIPS are inflation-linked government bonds that offer direct inflation protection, when nominal treasury bonds usually suffer from high inflation. Gold tends to be a decent hedge for uncertainty and is usually uncorrelated to both stocks and bonds, potentially lowering portfolio volatility and risk further.
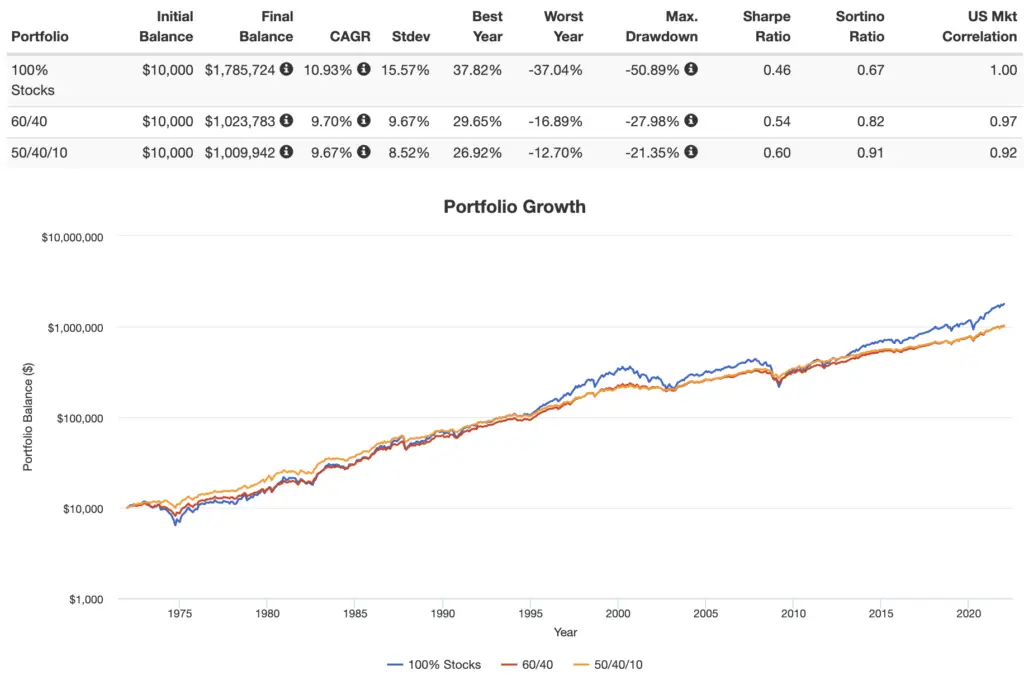
To illustrate this idea, notice how in the backtest below, the addition of each subsequent asset reduces the portfolio's volatility and maximum drawdown, creating a more efficient portfolio in terms of risk-adjusted return, but sacrifices some long-term total return in doing so. The first is 100% stocks; second is 60/40 stocks/bonds, and third is 50% stocks, 40% bonds, and 10% gold.

Intermediate treasury bonds specifically are a one-size-fits-most solution for a diversifier alongside stocks, for example. It's exactly what the ETF SWAN uses to protect from black swan events. TIPS are included in some lazy portfolios like the David Swensen Portfolio. The famous All Weather Portfolio utilizes gold to reduce the strategy's volatility.
All the aforementioned diversifiers have positive expected returns, albeit lower than stocks. But because these assets can sometimes become positively correlated during market turmoil and crash in tandem, it may be worthwhile in some instances to introduce assets that exhibit what we call negative carry, for which the cost of holding them is greater than their expected return. VIX futures, for example, a direct bet on market volatility per se, seem to be an unattractive negative carry tail risk hedge simply because of their high cost of ownership. I've said elsewhere that I view them as an insurance policy that isn't worth the premium.
An asset with less negative carry, and one that is a more direct hedge than the ones I've listed so far, is put options. Options contracts are derivatives. A put option gives the buyer the right, but not the obligation, to sell the underlying security at a specified price, called the strike price, within a specific time period. For example, if I buy shares of the S&P 500 today but I believe it might crash in the next month, I might buy a put option – called a protective put in this case – that would be expected to go up in value if the market does indeed crash. If the market instead keeps going up, I've simply lost the amount I paid for the option as it expires worthless.
Put options are a direct hedge on the very assets you're holding; they are a near perfect inverse. But we would entertain them as a tail risk hedge due to their possessing what we call convexity – the relationship between their value and the underlying security is nonlinear. In short, in this context, this means that the more significant the crash, the greater the payout from the option, at an accelerated rate greater than that of linearity. Under “normal” market circumstances, buying put options is a drag on the portfolio like in the previous example. Of course, we should expect this; the best hedge shouldn't come cheap. Still, unlike a long volatility play, the cost of this insurance policy is simply capped at the price of the options contracts.
Think of it this way using a simplistic, hypothetical example with made-up numbers. A diversified portfolio making use of put options may chug along at a modest annualized return of 5% for 10 years before earning a 100% return in a year with a severe market crash. Contrast that with a portfolio without put options earning a higher return of 10% for 10 years before suffering a 50% loss in a year with a market crash.
For the investors I mentioned earlier, this insurance policy may indeed be worth it, at the very least helping smooth returns over time. Unfortunately we can't know the future. Specifically, we know market timing is typically unfruitful, and while we can say a severe crash happens on average about every 7 years, we can't say how severe the next one will be and we don't know when it will occur.
Note that because of this, if for some reason you believe we will never again see an extremely severe market crash like we saw in 2008 (a silly belief in my opinion), you should probably not be looking to hedge your portfolio's tail risk, as you would likely be unable to stay the course with it due to tracking error regret from underperforming the market most of the time. A tail risk hedging strategy requires a sufficient understanding of the history of financial markets and a conscious acknowledgement of one's own biases and risk tolerance. This usually invariably comes with experience.
A new range of funds from Simplify like SPD make use of this idea of optionality, allocating a small percentage of the fund's assets to put options. Simplify maintain that this is also a way to “diversify your diversifiers,” which may be prudent as bonds enter a headwind.
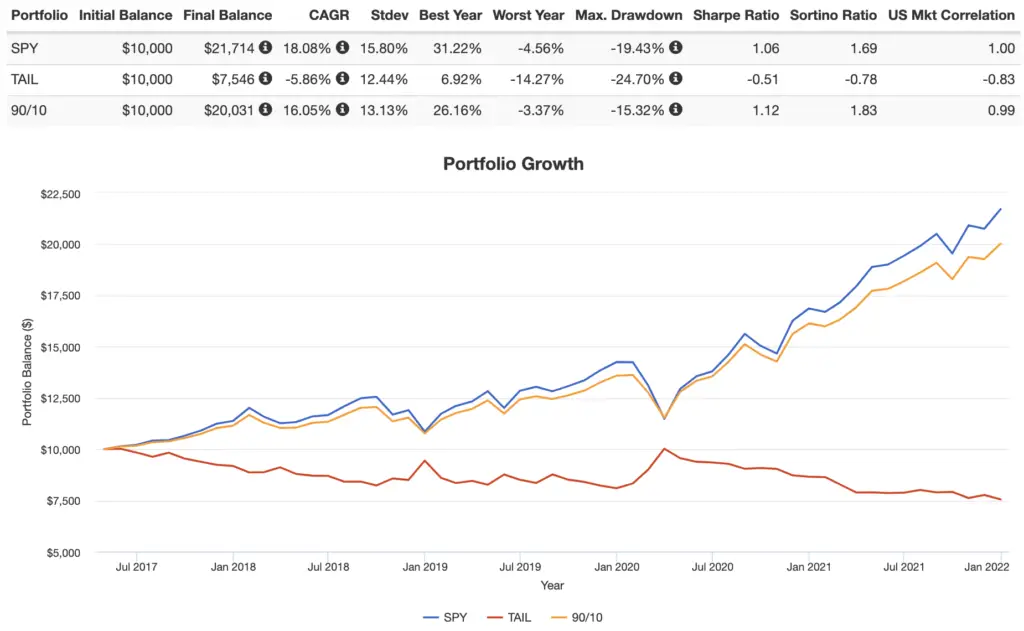
For those who don't want to manually roll put options themselves, there's even a put option fund from Cambria appropriately called TAIL, which holds mostly intermediate nominal and real treasury bonds to help pay for a small allocation to a ladder of out-of-the-money (OTM) put options on the S&P 500. I don't want to get too in the weeds on options specifics, but OTM options are cheaper and possess greater convexity. But because of this, we would only expect them to pay out big in a severe crash, not necessarily in a minor market dip.
TAIL launched in 2017, but notice how in the time period since, even though we haven't had a severe crash like '08, it has been a near inverse of the market, performing as we'd expect:

A Tail Risk Hedging Strategy Portfolio of ETFs
So what would a tail risk hedging strategy look like for a DIY retail investor using a portfolio of ETFs to hold in retirement? Here's my take.
Recall what I said above about tail risk hedging and volatility and risk reduction being far more important for the retiree or for the investor with a low tolerance for risk. If neither of these things applies to you, this is probably not the portfolio for you. It would almost certainly be far too conservative for a young accumulator with a long time horizon and high tolerance for risk, unless you're a market timer who wants liquidity in a crash to pick up some stocks while they're on sale.
Here we're taking all the assets I mentioned in the section above – global stocks, treasuries, TIPS, and gold – and combining them at near-risk-parity allocations, and then adding a dash of put options.
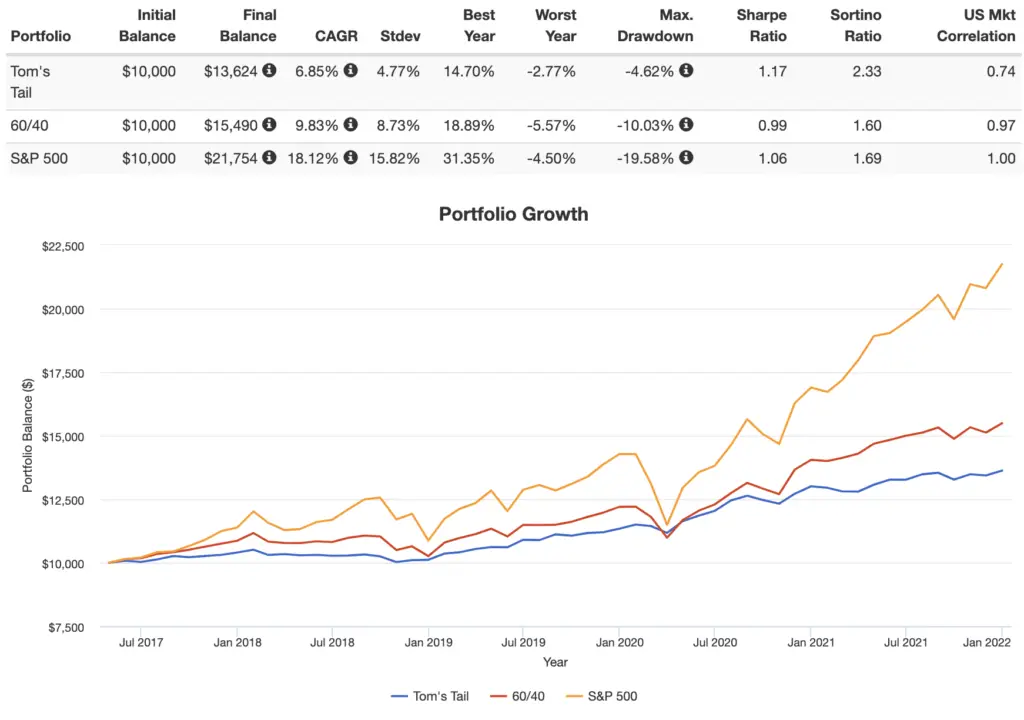
We can call it Tom's Tail Risk Portfolio:
30% Global Stock Market
25% Total U.S. Treasury Bond Market
25% Intermediate TIPS
10% Gold
10% TAIL ETF (OTM put options)
Remember that TAIL has only been around since mid-2017, and we can't backtest options themselves, so here's how this portfolio would have looked over that brief time period through 2021 versus a classic 60/40 and the S&P 500:

We can construct Tom's Tail Risk Portfolio using ETFs as follows:
30% VT
25% GOVT
25% SCHP
10% SGOL
10% TAIL
I've created that pie here if you're using M1 Finance.
Is your portfolio hedged against tail risk? Let me know in the comments.
Are you nearing or in retirement? Use my link here to get a free holistic financial plan and to take advantage of 25% exclusive savings on financial planning and wealth management services from fiduciary advisors at Retirable to manage your savings, spend smarter, and navigate key decisions.
Disclosures: None.
Disclaimer: While I love diving into investing-related data and playing around with backtests, this is not financial advice, investing advice, or tax advice. The information on this website is for informational, educational, and entertainment purposes only. Investment products discussed (ETFs, mutual funds, etc.) are for illustrative purposes only. It is not a research report. It is not a recommendation to buy, sell, or otherwise transact in any of the products mentioned. I always attempt to ensure the accuracy of information presented but that accuracy cannot be guaranteed. Do your own due diligence. I mention M1 Finance a lot around here. M1 does not provide investment advice, and this is not an offer or solicitation of an offer, or advice to buy or sell any security, and you are encouraged to consult your personal investment, legal, and tax advisors. Hypothetical examples used, such as historical backtests, do not reflect any specific investments, are for illustrative purposes only, and should not be considered an offer to buy or sell any products. All investing involves risk, including the risk of losing the money you invest. Past performance does not guarantee future results. Opinions are my own and do not represent those of other parties mentioned. Read my lengthier disclaimer here.

Are you nearing or in retirement? Use my link here to get a free holistic financial plan and to take advantage of 25% exclusive savings on financial planning and wealth management services from fiduciary advisors at Retirable to manage your savings, spend smarter, and navigate key decisions.


Have you ever done any research on $CAOS? Looks like a better designed (but more complicated) version of TAIL. basically OTM puts + BOXX etf for collateral (more tax friendly)+20% or so exposure to SPY through Calls. AVOLX the mutual fund it was based on had positive carry and a 25-30%+ month in March 2020 I believe.
CYA interesting too but they have been rocked this year
The more I look over the various portfolios, the more I like the Tom’s tail risk since I’m in retirement and am concerned about downturns in the immediate future so I don’t mind sacrificing a little CAGR for additional safety. But… I also like the value tilt you use in your Ginger Ale portfolio for equities since I really think value is going to be strong with interest rates rising.
So what would you think of slicing up the Stock allocation in Tom’s Tail Risk according to your Ginger Ale portfolio? Admittedly, the slices of pie get pretty small.
Hey John,
Thanks for all the great content on your site!
I think you make some great suggestions on ways to use hedged ETF’s. If folks have options experience and want more flexibility, here is a article from Schwab that goes into more detail of a “roll your own hedge ” strategy that would allow you to stay in an existing highly S&P 500 correlated position, such as NTSX, without having to move to SPD, etc.
https://www.schwab.com/resource-center/insights/content/how-to-hedge-your-portfolio
Thanks, Dave! I’d guess most of my readership – myself included – don’t want to (or don’t know how to) roll options themselves. Just comes down to whether or not you want to pay someone to do it for you with funds like TAIL, CYA, SPD, etc.
Thanks for this. Would some tail risk hedging also be advisable for those of us who are running highly leveraged NTSX in a taxable account? My fear had been in a substantial enough drawdown, any liquidation would really eat into future performance (since there’s a loss from taxes for realized gain). An allocation to CYA or TAIL could help limit the loss from paying taxes.
I think so.
Do you have any way to model what different allocations of CYA would look like with different market crash scenarios? Love the information on the website.
No.