Financially reviewed by Patrick Flood, CFA.
The All Weather Portfolio is a well-diversified, low-risk portfolio from Ray Dalio designed to “weather” any environment. Here we'll look at the All Weather Portfolio's components, historical performance, ETFs to use in 2025, and various leveraged strategies.
Interested in more Lazy Portfolios? See the full list here.
Disclosure: Some of the links on this page are referral links. At no additional cost to you, if you choose to make a purchase or sign up for a service after clicking through those links, I may receive a small commission. This allows me to continue producing high-quality content on this site and pays for the occasional cup of coffee. I have first-hand experience with every product or service I recommend, and I recommend them because I genuinely believe they are useful, not because of the commission I may get. Read more here.
Contents
Video
Prefer video? Watch it below. But note the video is just a general overview of the “base” portfolio and does not include the discussions on leverage or replacing Commodities with Utilities, so you'll have to scroll down further for those.

What Is the All Weather Portfolio and Who Is Ray Dalio?
First, we'll take a brief look at what this portfolio is comprised of, and why. The All Weather Portfolio is an available-to-the-masses portfolio modeled somewhat after the risk-parity-based All Weather Fund from the famous hedge fund Bridgewater Associates. The portfolio idea was created by the legendary Ray Dalio, founder of Bridgewater, and was then popularized by Tony Robbins. Dalio has become almost like a god in the world of finance and investing, and rightfully so. I would highly recommend his bestselling book Principles, as well as his more recent book Big Debt Crises. His newest book from November, 2021 is Principles for Dealing with the Changing World Order: Why Nations Succeed and Fail.
Bridgewater is perhaps most famous for their focus on and analysis of different economic cycles in “the economic machine.” Their All Weather Fund – and subsequently the All Weather Portfolio – is designed to survive all economic environments, using different types of assets that perform differently during those different “seasons.” Appropriately, it is also sometimes referred to as the “All Seasons Portfolio.”
While Bridgewater is constantly watching the market and the economy, Dalio himself admits that he can’t predict the future, thus the need for a portfolio that mitigates the financial impact of unexpected economic events, known as black swan events. The All Weather Portfolio becomes especially attractive during periods of market turmoil, particularly for investors who have a low risk tolerance and/or are primarily concerned with capital preservation.
It has long been known that portfolio diversification mitigates risk and volatility. The All Weather Portfolio seemingly maximizes diversification using a variety of asset classes. This diversification benefit is borne of the inherent uncorrelation of these assets, e.g. when stocks go down, bonds tend to go up. This conveniently obviates the need for any attempt at or anxiety over market timing or guesswork. Dalio actually explicitly maintains that attempting to time the market is a fool's errand.
Note that the All Weather Portfolio as it is prescribed is not based on true risk parity of the assets, but it is pretty close. It is simply the product of an interview between Tony Robbins and Ray Dalio in which Dalio suggested that these weightings, without leverage, would be suitable and easy to manage for the average investor. Dalio even suggested that these weightings “would not be exact or perfect.” I explore options for actual risk parity below later on in this post. In fairness, the real All Weather Fund at Bridgewater – after which this portfolio is modeled – seems to be based on risk parity of the 4 economic seasons listed below.
As the name suggests, the All Weather Portfolio is designed to be able to “weather” any storm. It uses asset class diversification based on seasonality in the interest of limiting volatility and drawdowns. The holdings and the allocations thereof correspond to Dalio's view on economic “seasons.” Dalio's strategy and expertise are so pervasive that the phrase “all weather” is now used to describe other portfolios that behave like his in surviving any economic climate, e.g. “investing in an all weather portfolio.”
Dalio proposes that the following four things affect asset value:
- Inflation
- Deflation
- Rising economic growth.
- Declining economic growth.
Based on these, Dalio expects we can see 4 “seasons” of the economy, with particular assets corresponding to each quadrant:
- Higher than expected inflation.
- Lower than expected inflation.
- Higher than expected economic growth.
- Lower than expected economic growth.
Dalio chose asset classes that performed well in each of these different seasons or “quadrants,” attempting to maintain roughly equal risk exposure among the 4 quadrants, with the goal being diversification that allows for consistent growth and small drawdowns. As such, the portfolio is mostly bonds, and only allocates 30% to stocks.
Ray Dalio All Weather Portfolio Asset Allocation
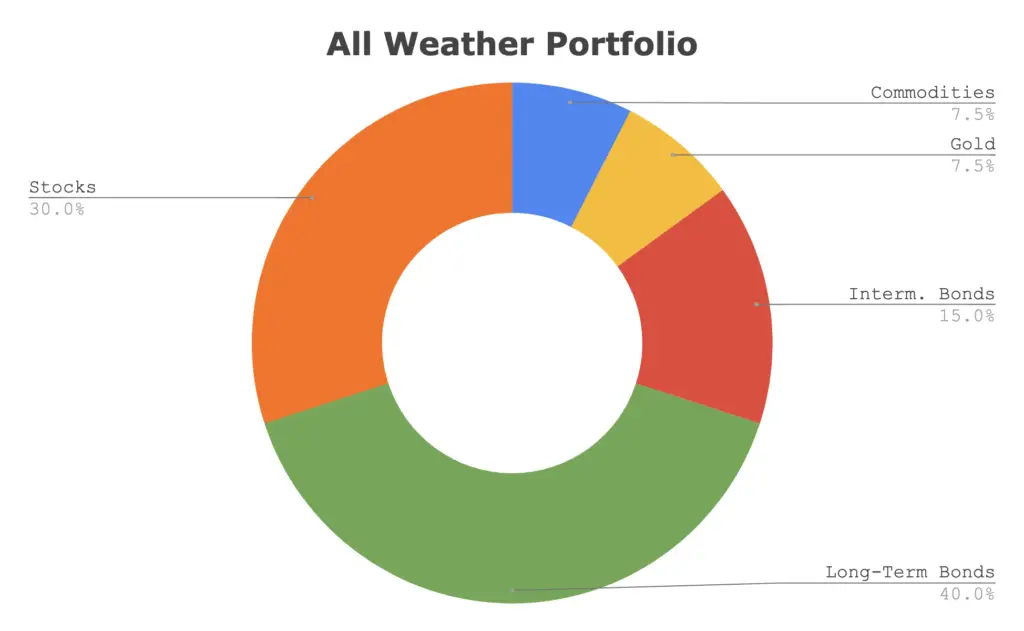
The All Weather Portfolio asset allocation looks like this:
- 30% U.S. Stocks
- 40% Long-Term Treasury Bonds
- 15% Intermediate-Term Treasury Bonds
- 7.5% Commodities
- 7.5% Gold
How To Build the Ray Dalio All Weather Portfolio
M1 Finance would be a good choice for U.S. investors to implement the All Weather Portfolio so that you can easily and seamlessly rebalance as often as you'd like, and it has zero transaction fees. I wrote a comprehensive review of M1 Finance here.
Using some low-cost Vanguard funds and my “best in class” ETFs, we can build the All Weather Portfolio (here's the pie) like this:
30% VTI
40% VGLT
15% SCHR
8% GLDM
7% BCI
To add this pie to your portfolio, just click this link and then click “Invest in this pie.”
Canadians can find the above ETFs on Questrade or Interactive Brokers. Investors outside North America can use Interactive Brokers.
To diversify internationally with the All Weather Portfolio above, simply replace VTI (Vanguard's total US stock market ETF) with VT (Vanguard's total world stock market ETF). That pie can be found here.
All Weather Portfolio Performance vs. S&P 500
With live fund data for Commodities only going back to 2003, here's the All Weather Portfolio vs. a traditional 60/40 portfolio and the S&P 500 through 2022:
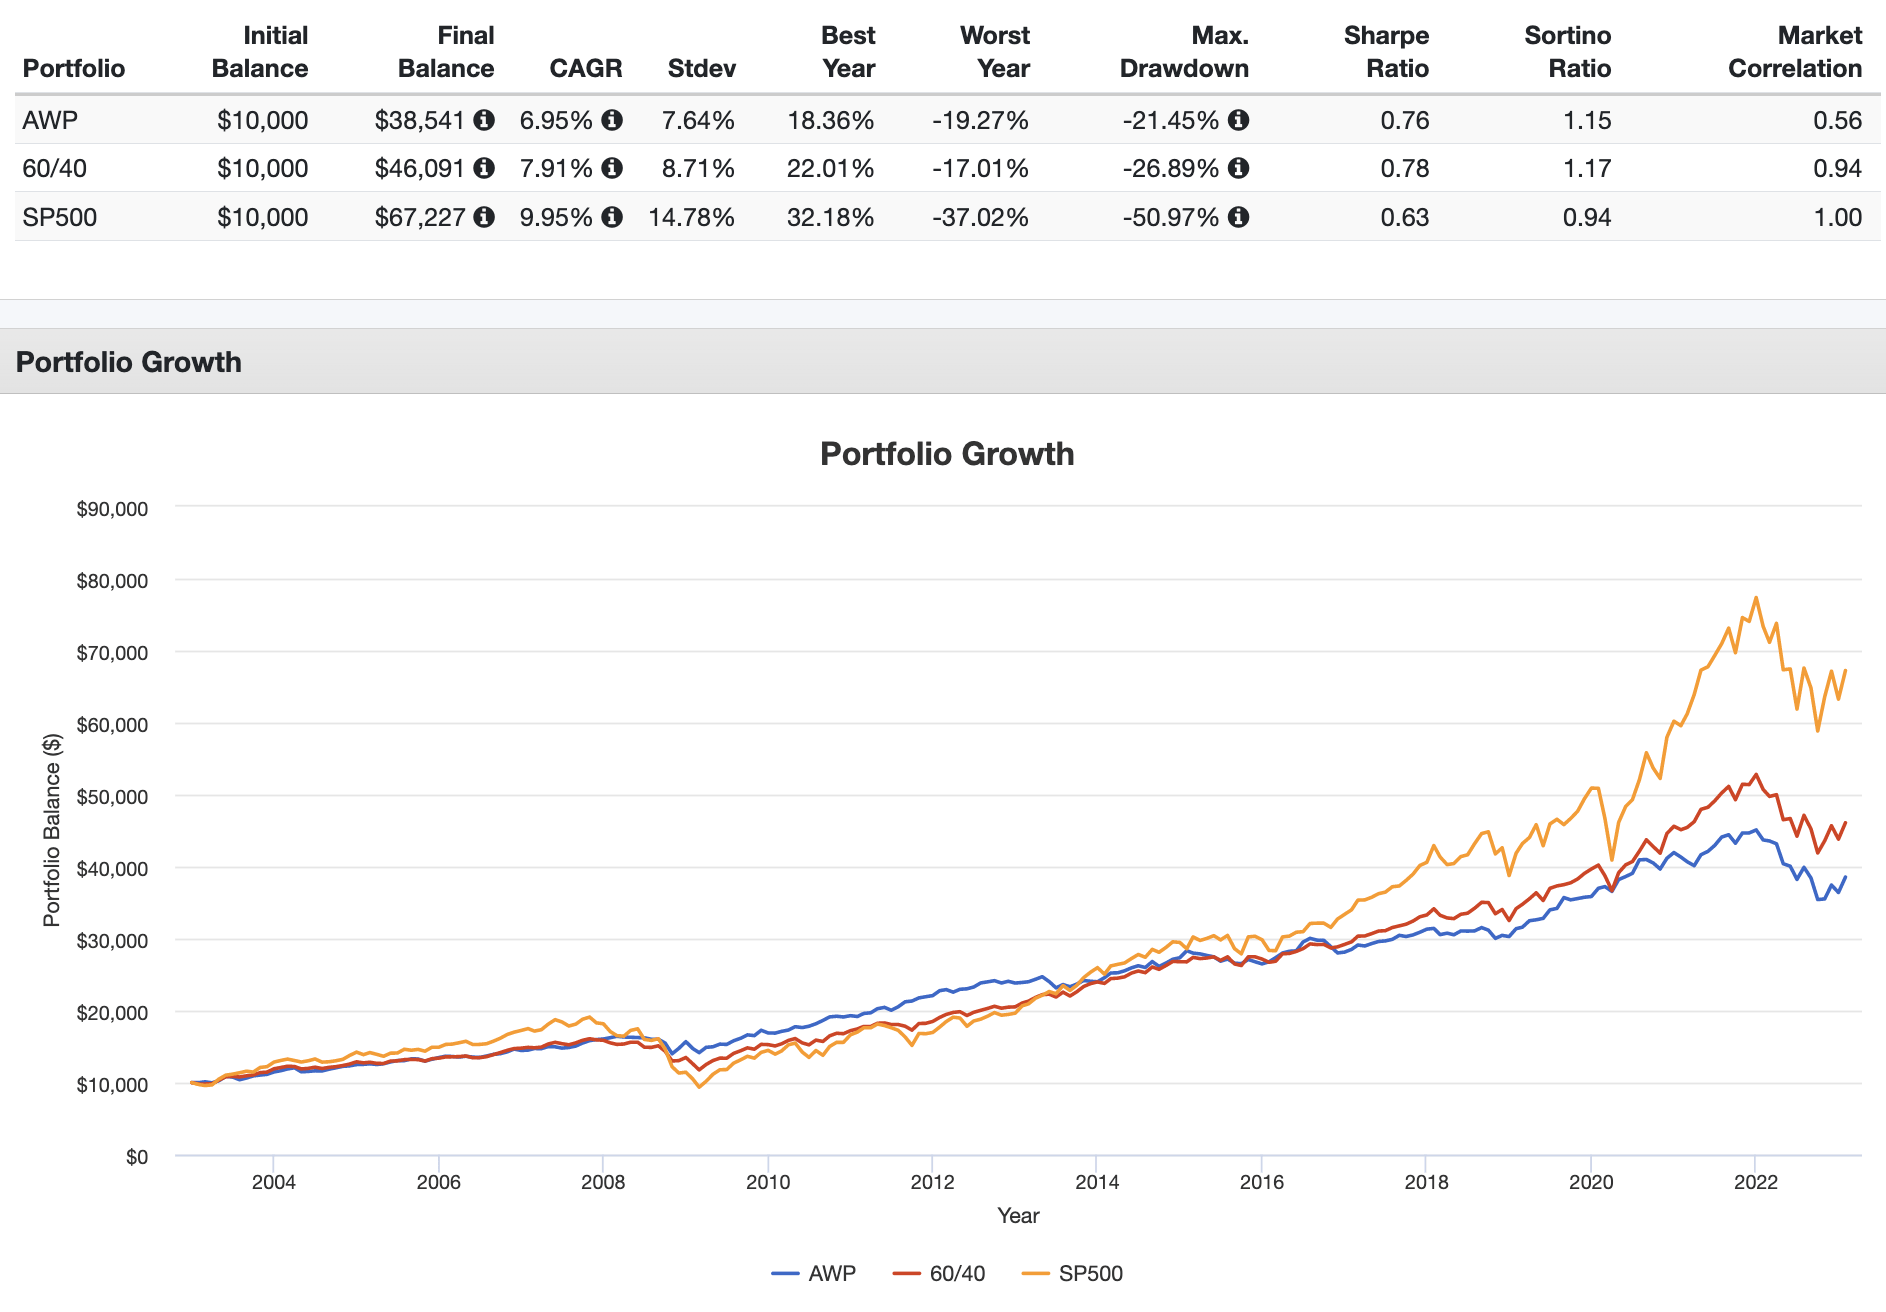
As we'd expect, the All Weather Portfolio has had less than half the volatility and, consequently, a much higher risk-adjusted return (Sharpe) and significantly smaller drawdowns versus the S&P 500. This shows the All Weather Portfolio doing precisely what it's intended to do: weather any storm.
Personally, I probably wouldn't adopt the All Weather Portfolio unless I were near or at retirement age, or if for some reason I absolutely couldn't mentally and emotionally endure volatility and drawdowns (which is a very real case for some). The gold, commodities, and heavy bond allocation would likely just drag down long-term total return since it only has 30% allocated to stocks.
We can see the All Weather Portfolio had a slightly lower return with a nearly identical risk-adjusted return compared to a 60/40 portfolio for this period.
I'm also usually not even a fan of gold or commodities period; they have no place in my portfolio at this time. That said, this would be a good set-and-forget portfolio, making it attractive for investors who want to be hands-off, and it is probably my favorite of the volatility-minimizing, any-economic-climate portfolios like the Permanent Portfolio, Golden Butterfly, and Ivy Portfolio.
However, as I'll explore later below, levering up this same asset allocation may dramatically improve returns while still maintaining a sensible level of portfolio risk similar to that of an unlevered 100% stocks position, depending on the amount of leverage used.
But first, let's talk about swapping out those Commodities for something else.
Using Utilities Instead of Commodities (and REITs)
Commodities have been used in the past for their purported diversification benefit from their inherent low correlation to the total stock market, and the nature of the asset class being physical necessities on which futures are traded. The same can be said for real estate (REITs).
Commodities are materials like gold, oil, copper, livestock, agriculture, etc. Their value depends on their usage in production, and is directly related to supply and demand. Any position in commodities is therefore a bet on the short-term future, rather than long-term growth associated with stocks, bonds, real estate, etc. As such, investors have historically turned to commodities as a hedge against uncertainty.

Unfortunately, commodities themselves are unpredictable by their very nature. Crops go bad. The weather changes. Macroeconomic policies shift. Alternatives to things like copper are found. Ownership, storage, and transportation of commodities increase costs.
Stock ownership is a claim on a company’s future earnings. A bond is a contractual obligation between a lender and a borrower, with interest payments going from the latter to the former. Ownership of a commodity is not value-producing; it involves no earnings or cash flow and is simply a bet on production and/or consumption at that time.
Commodities are obviously useful to your everyday life, but not so much as an investment in securities markets. Think of owning a commodities fund as just paying for their storage somewhere.
With technological advances, we would expect commodity prices to fall or stay flat over the long term. After fees (commodities funds are expensive; the popular PDBC costs 0.62%), commodities are likely losing to inflation. And indeed they have historically; even though they soared in 2021, commodities have had negative real returns over the last 100 years.
Essentially, even in inflationary environments, investors have historically been better off over the long term holding just about anything other than commodities. And we now have assets like REITs, TIPS, etc. as alternatives. Even a narrow gold fund should be a better choice than broad commodities. Commodities may offer a tiny diversification benefit to lower volatility and risk, but we still want our diversifiers to have positive future expected returns.
Andrew Tobias, in The Only Investment Guide You'll Ever Need, maintains that “it is a fact that 90% of all people who play the commodities game get burned. I submit that you have now read all you ever need to read about commodities.”
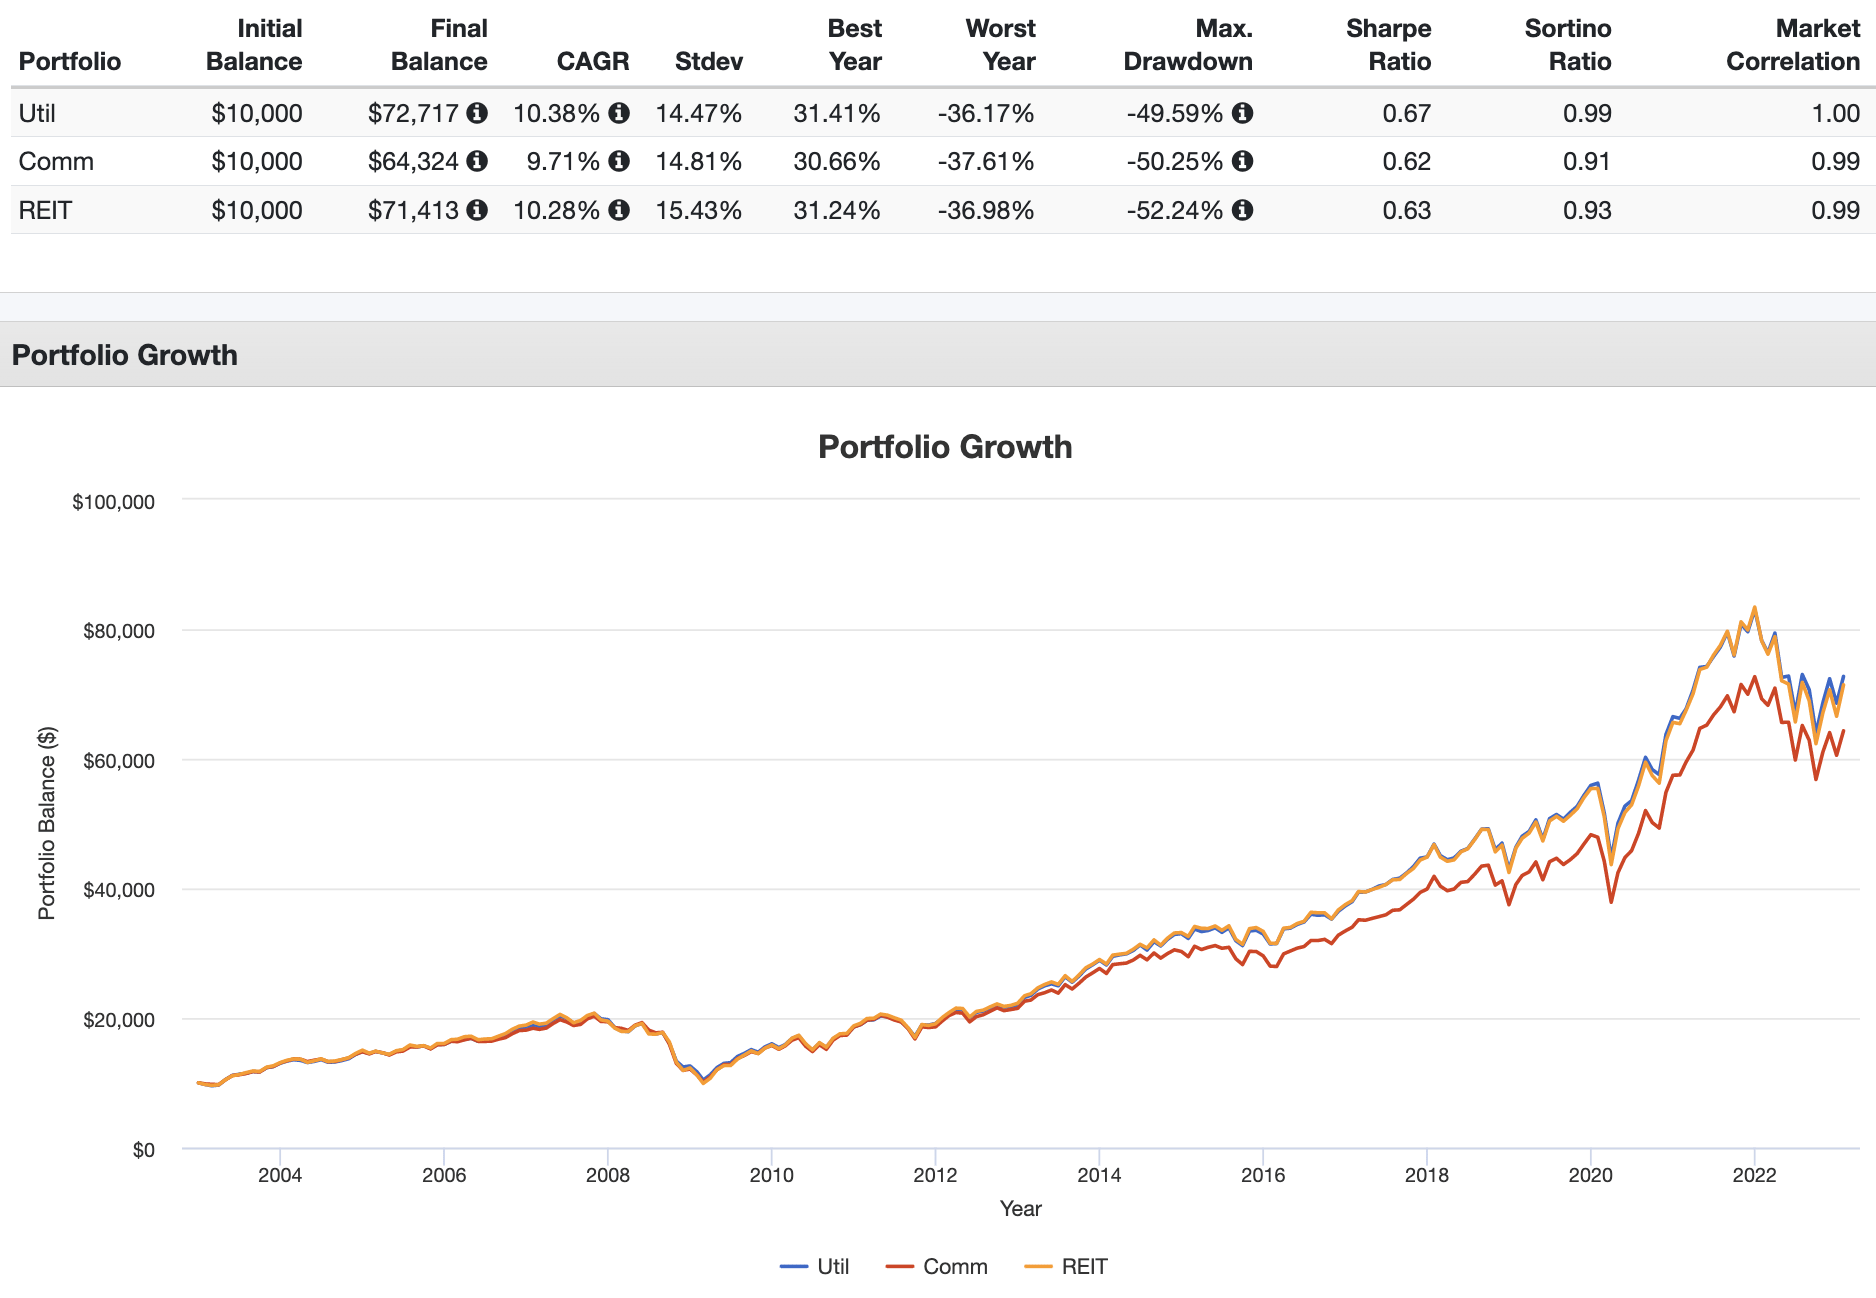
I don't bet on sectors, but over the past 20 years, the Utilities sector has had the lowest correlation to the total stock market of any sector, lower than that of both Commodities and REITs – specifically, 0.38 for Utilities compared to 0.53 for Commodities and 0.59 for REITs. Yet REITs and Commodities are both treated as classes of their own and are used as diversifiers, while Utilities are simply thrown under the equities umbrella at their market weight and forgotten.
Using live fund data for Commodities going back to 2002, through 2022, the results corroborate this idea. I backtested portfolios using 90% total stock market with respective 10% tilts using Utilities, Commodities, and REITs. Utilities provided the lowest volatility, smallest drawdown, highest return, and highest risk-adjusted return:
Some other macroeconomic things to consider are:
- We'll always need energy of some form, whether that's solar, wind, natural gas, etc.
- Utility operating costs are passed on to the ratepayer.
- Demand for utilities stays relatively constant (it is said to be noncyclical), which is a significant reason why utilities perform comparatively well during market downturns.
- Perhaps most importantly, using Utilities instead of REITs lets you avoid the idiosyncratic, uncompensated risk of the real estate market.
- Of all sectors, Utilities are the least explained by the known equity factors that explain the differences in returns between diversified portfolios. Their R-squared ratio is notably lower than that of REITs. From this paper:
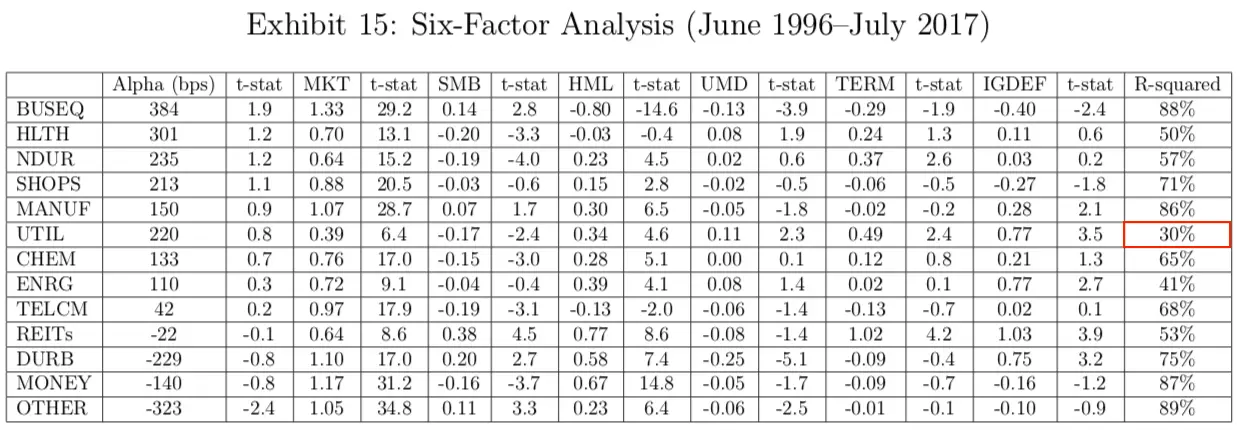
So, at least for the relatively small 7.5% slice for the All Weather Portfolio, I would submit that Utilities are a fine – and likely superior – replacement for Commodities.
Here's how that swap would have worked out historically:
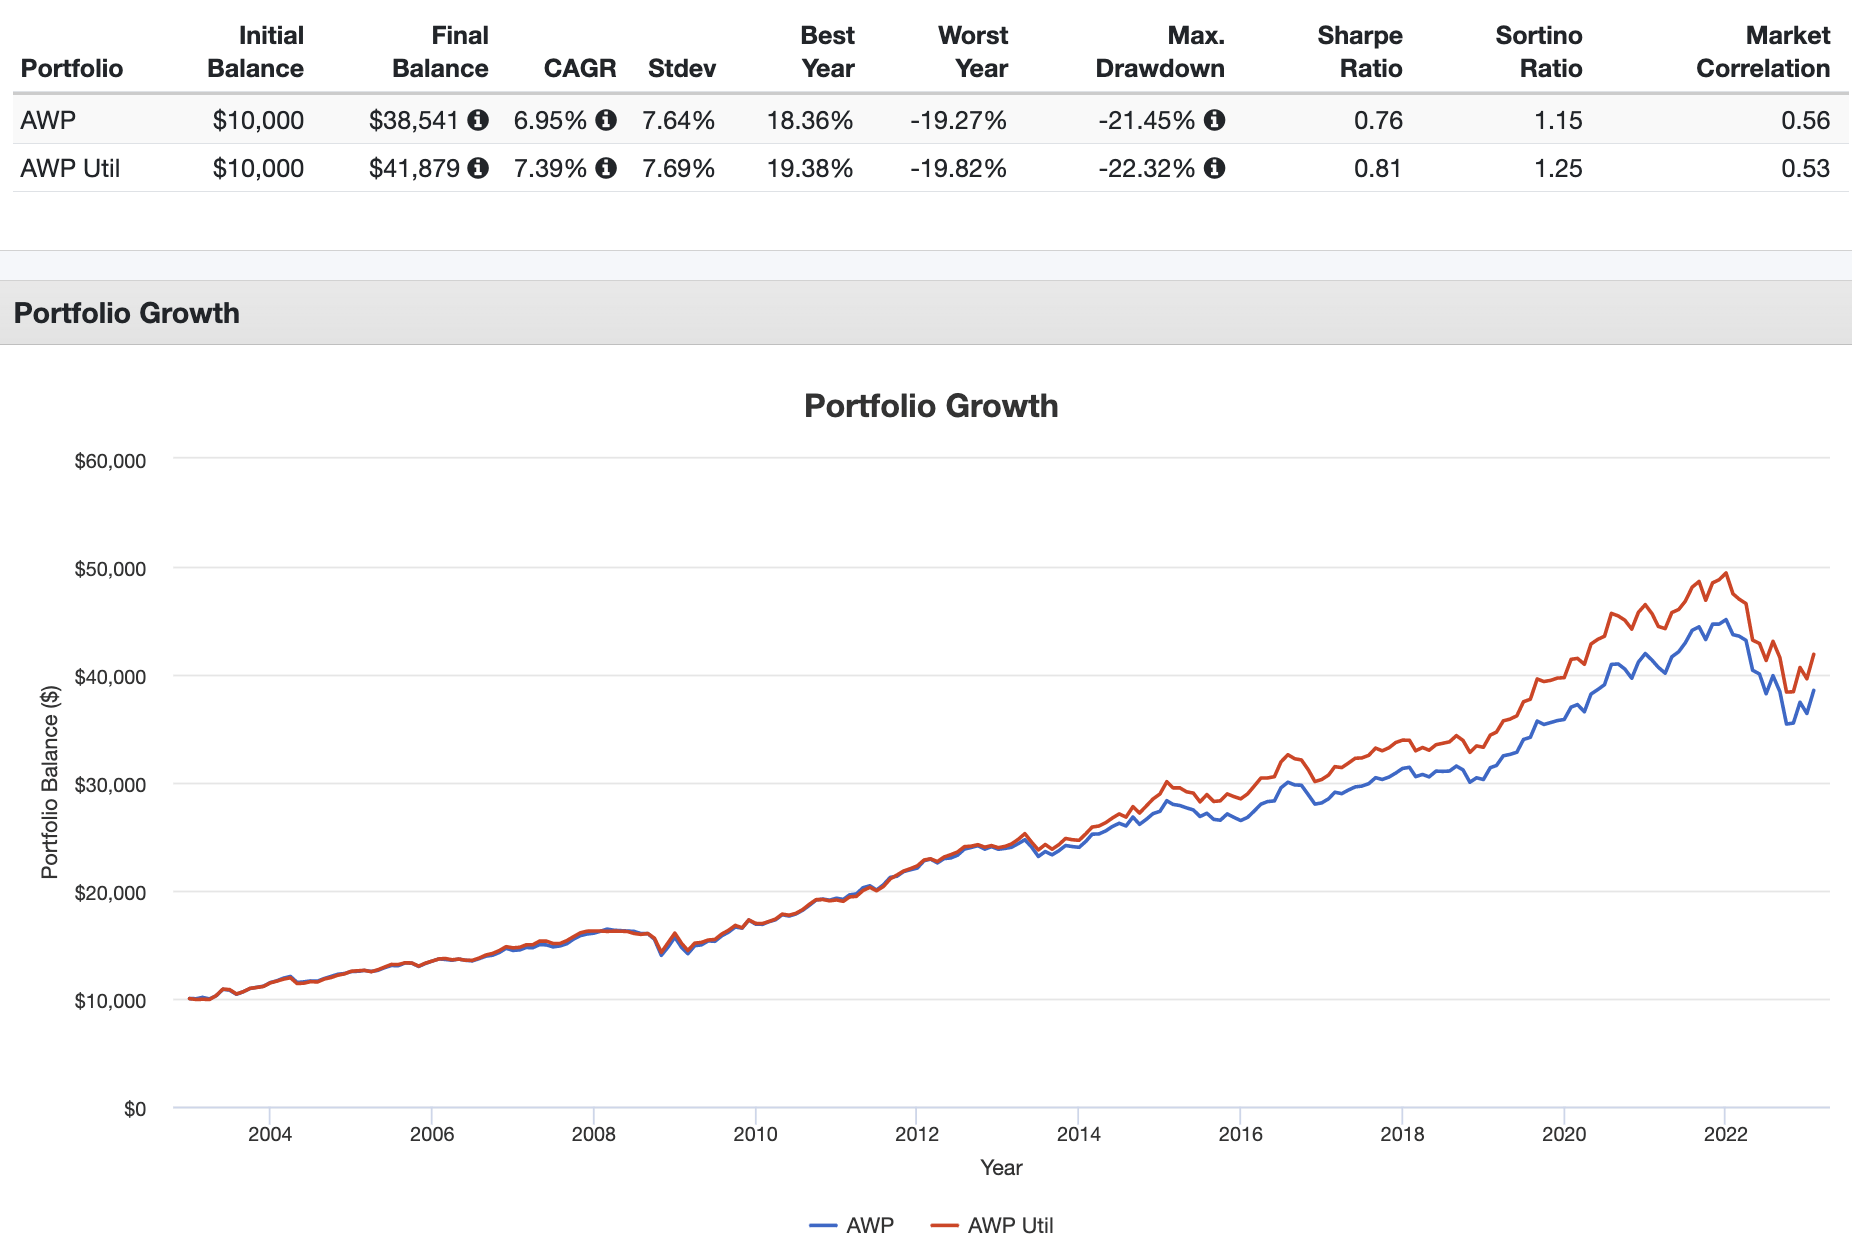
Notice how the AWP with Utilities beat the “normal” AWP on almost every important metric.
For those wanting this All Weather Portfolio using Utilities instead of Commodities, I've created that pie here. It looks like this:
30% VTI
40% VGLT
15% SCHR
8% FUTY
7% GLDM
You can invest in this portfolio here.
Applying Leverage To the All Weather Portfolio
Applying leverage to those same allocations gets you enhanced exposure to what is traditionally a low-risk, low-volatility portfolio. Most people don't realize that Dalio and Bridgewater themselves deploy leverage in their in-house All Weather Fund. So perhaps this could be a solution for a risk-averse investor who still wants to get in on the leverage game in an attempt at higher returns to beat the market.
Of course, this isn’t a new idea. Stemming from the foundation of Markowitz's Modern Portfolio Theory is the demonstrable idea that we can allocate assets based on their relative “risk” – not dollar amount – and then lever up to increase exposure, thereby constructing a more efficient portfolio than one of a single asset. For example, a classic 60/40 portfolio levered up to match the volatility and risk of 100% equities has delivered higher returns historically. As an aside, this is exactly what the fund NTSX does and is also the basis of the famous Hedgefundie strategy.
Leverage is the necessary key to generating the requisite return for any given efficient (“optimal”) portfolio for which the expected return is too low to meet the investor’s objective. After all, the goal is to fund future consumption, not just achieve the best Sharpe ratio. By “efficiency,” we mean greater return per unit of risk, or what we call risk-adjusted return, of which Sharpe ratio is one definition. This concept holds true across multiple definitions of “risk,” including volatility, tail risk, and even Dalio’s economic “seasons.”
Allocating multiple assets based on risk and levering up makes use of the benefits of diversification, on which I’m always harping. Remember, diversification is the closest thing we have to a free lunch in investing. Leverage allows us to make use of that free lunch while also increasing expected return. We see this demonstrated here in Dalio’s famous retail portfolio, in which return-driving stocks take up a relatively low allocation, while comparatively lower risk bonds comprise a higher allocation, which is uncharacteristic of traditional growth portfolios. Conventional portfolios increase expected return not with leverage but with concentration in riskier assets, e.g. stocks.
The legendary Cliff Asness maintains that risk parity “works” precisely due to investors’ irrational aversion to – or the disallowed use of – leverage, and due to lower risk assets having higher risk-adjusted returns than they theoretically should. The story goes that because some investors are averse to or are not allowed to use leverage and thus go the route of concentration, those assets in which they concentrate have lower expected returns, leaving higher risk-adjusted returns to be had by lower-risk assets. This is consistent with the famous “low beta anomaly” in stocks. There’s also another theoretical underpinning that favors the risk parity and leverage approach: Past volatility is more correlated with future volatility than past returns are with future returns. That is, we can make more reliable guesses about future asset volatility than about future asset pricing.
The knee-jerk aversion to the word “leverage” usually comes from those who have a poor understanding of its utility in multi-asset portfolios. Anyone who has a mortgage is using leverage. If you’ve taken out student loans, you’ve levered up your human capital. Even if you’re 100% equities, the companies you’re holding carry debt on their balance sheets.
Moreover, leveraged scenarios that blew up historically were usually the result of combining leverage with concentration in a single asset. “Return stacking,” as it’s been called, is simply adding different sources of returns within a leveraged framework to avoid sacrificing performance. In doing so, the leverage ratio per se tells us little about the riskiness of the portfolio. Again, products like PSLDX and NTSX are examples of this concept.
Make no mistake that increasing leverage is increasing risk. But Asness submits that, compared to concentration, the use of leverage is a more manageable, more rewarding, and more reliable assumption of additional risk. I’ve said sort of the same thing when discussing stock picking with people, noting that the investor willing to take on the greater risk of picking a handful of stocks should almost certainly prefer to simply apply leverage to a broad index commensurate with the same level of risk instead. Even Warren Buffett, the ever ardent proponent of an S&P 500 index fund, has long used leverage in the form of low-cost insurance float, which he noted has always given Berkshire “quite an edge,” to amass a fortune.
Some obligatory preliminary warnings:
- I'm not a financial advisor and this is not financial advice. It's for informational and recreational purposes only. Products discussed below are for illustrative purposes only. This is not a recommendation to buy, sell, or transact in any of the products mentioned. Do your own due diligence.
- Past results do not indicate future performance.
- Research and read up on the fundamentals of leverage and the nature of leveraged ETF products before blindly buying in. It can potentially be a very dangerous game. Using leverage increases the potential for greater returns but also the potential for greater losses. The use of leverage increases portfolio risk, and investors face a real possibility of losing all money invested. Specifically with leveraged ETFs, these are relatively new, exotic products that behave differently than “regular,” unleveraged index ETFs. Do your due diligence and read the fine print.
- Similarly, don't put your entire portfolio in a strategy like this. If you want to play with something like this, do so with a small piece of your total portfolio, and definitely not with money you'll need in the next 5-10 years. If you're using M1 Finance, make this a sub-pie within your larger pie.
- I had a hard time finding leveraged commodity index ETF's (probably for good reason) so I somewhat arbitrarily chose a couple oil-and-gas ones I found. There may be better options. This is more just meant to be a discussion starter and a first iteration from which to improve. I discuss improvements using the Utilities sector below.
- Moreover, I realize this may not be the optimal approach for what it's trying to achieve. Again, I'm not a fan of gold and commodities; I think I've fared better playing around with tilting with utilities and consumer staples in my cauldron of leverage: UPRO, TQQQ, TMF, UTSL, and NEED. This is simply taking the unedited All Weather Portfolio and applying leverage to it. More on this later, with variations using Utilities in place of Commodities.
- Of course, I also realize that applying leverage to the All Weather Portfolio sort of defeats its whole purpose, but the historical volatility, return, and drawdown KPI's compared to the S&P 500 index and a 60/40 portfolio were much more impressive than I anticipated. More on that later. I'm viewing it as a way to diversify and limit volatility and drawdowns with the underlying assumption that one has already chosen to invest with leveraged products.
- The linked backtests using Commodities only go back to 2006. We get to see performance through the GFC, but not during a runaway period like the late 1970's in the US. The All Weather Portfolio's large allocation to long-term treasury bonds still expose it to interest rate risk.
- The fees alone for the gold and commodities may be a major drag on the strategies' performance, with the trade-off being the extra diversification and subsequent drawdown protection and volatility reduction. They are probably not responsible for any of the actual returns of the strategies. Is it worth it? I don't know.
- This would require some regular maintenance in the form of rebalancing, as the allocations may stray quickly. Quarterly should be fine. I explore different rebalancing intervals at the end of this post.
- M1 Finance doesn't allow a 7.5% holding so I used 8% gold and 7% commodities.
Aren't Leveraged ETF's Unsuitable for Holding Long-Term?
There's no shortage of articles lambasting the idea of holding leveraged ETF's for more than one day, reciting that they should “only be used for intraday trading.”
However, I firmly maintain that the idea that leveraged ETF’s are unsuitable for long-term holding is largely overblown fear mongering that’s been wrongly perpetuated after the financial blogosphere took the scary-sounding “volatility decay” and ran with it.
“Volatility decay” sounds like a bad thing, but viewing it as such is simply a misunderstanding of what it actually is and its underlying mechanics and arithmetic. If you're curious to see the math, check out this page.
That same “decay” actually works in your favor when the market goes up with decent momentum, which it does more often than it goes down. This is why UPRO, the 3x leveraged S&P ETF, has delivered close to 5x the returns of the SPX since its inception instead of the proposed 3x.
In short, I concede that leverage can indeed be dangerous in certain situations, but can be useful in others.
2x Leveraged All Weather Portfolio
So here's the portfolio using 2x leverage:
30% SSO – 2x S&P 500
40% UBT – 2x LT treasury
15% UST – 2x IT treasury
7.5% DIG – 2x oil and gas
7.5% UGL – 2x gold
You can add this pie to your M1 Finance portfolio here, but stay tuned for the variation using Utilities below, as I don't feel completely comfortable using DIG.
3x Leveraged All Weather Portfolio
And here's that portfolio with 3x leverage:
30% UPRO – 3x S&P 5
40% TMF – 3x LT treasury
15% TYD – 3x IT treasury7.5% GUSH – 3x oil and gas7.5% UGLD – 3x gold
Update April 2020: After Direxion's changing GUSH from 3x to 2x effective March 31, 2020, I would consider using 3x Utilities, REITs, or Consumer Staples, accessed via UTSL, DRN, and NEED respectively. Note that because of this, the 2 backtests immediately below are no longer accurate. Skip to the next section to get the most recent updates and new backtests. Unfortunately, at the time of writing, M1 Finance doesn't offer the NEED (3x Consumer Staples) ETF. Below I explain why Utilities are probably the best choice, and I've included a pie link for that option.
Update June 22, 2020: With the recent market turmoil, Credit Suisse announced today that it plans to delist some of its 3x leveraged VelocityShares™ ETN's, including UGLD. With no other 3x gold funds available, the next logical choice would be UGL, the 2x gold ETF from ProShares. Keep in mind gold is already an extremely volatile asset, so this shouldn't throw anything off too much considering it only has a 7.5% allocation. This will slightly change the allocations of the leveraged risk parity portfolio at the end of this post. Also note that because of this, the 2 backtests immediately below are no longer accurate. Skip to the next section to get the most recent updates and new backtests.
Below is a backtest going back to 2006 comparing the above 2 with the Hedgefundie 55/45 strategy and the S&P 500 index.
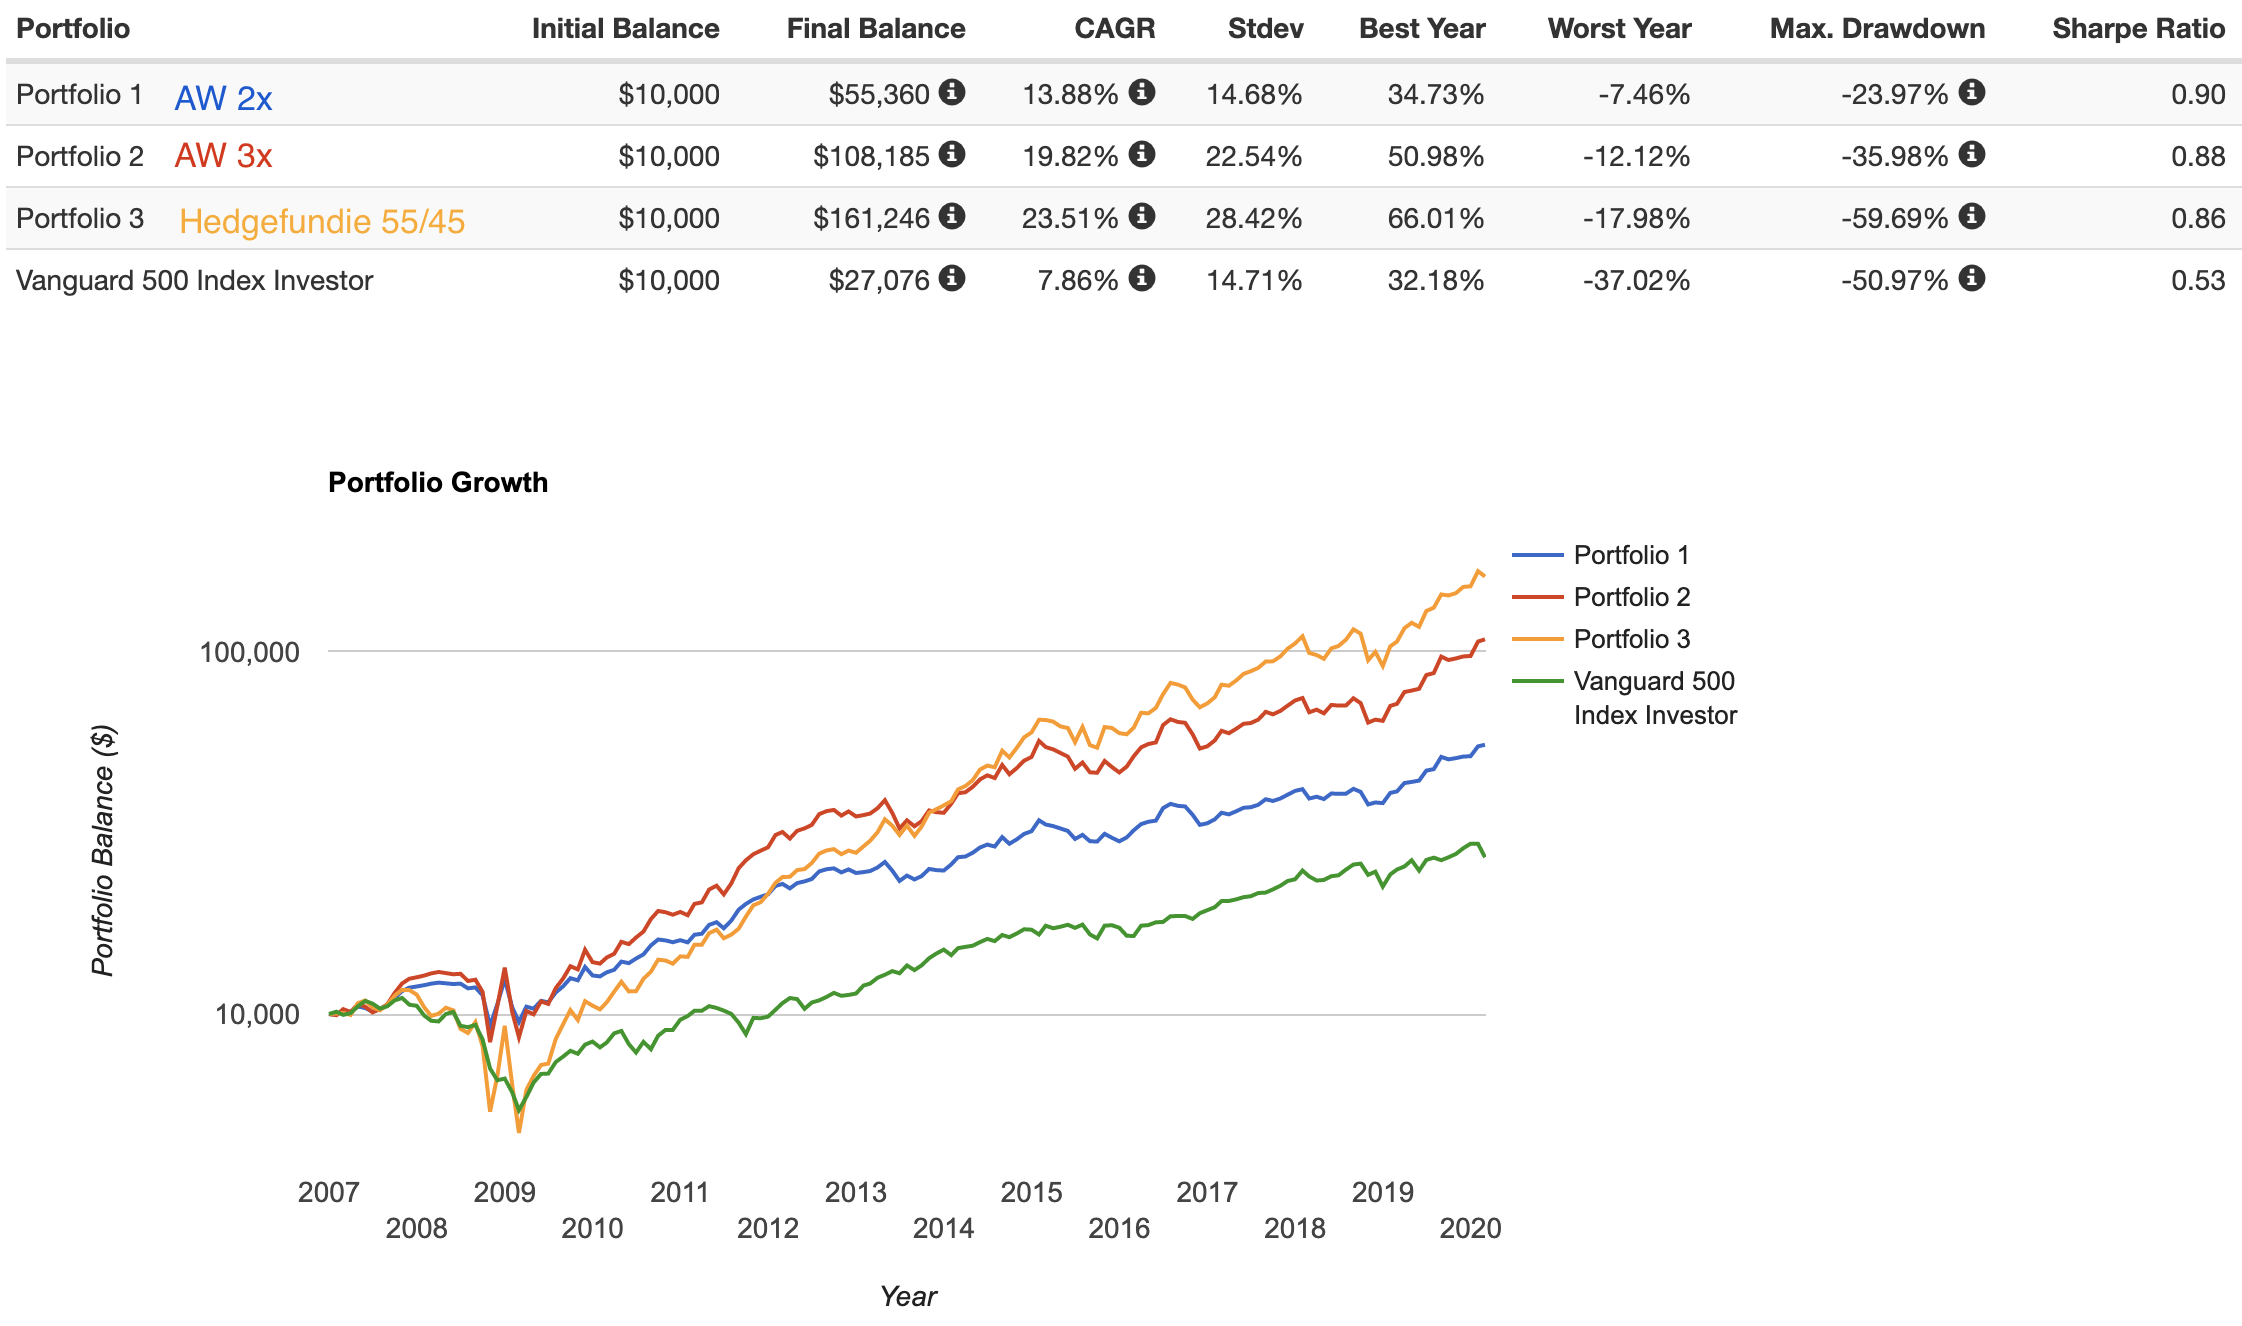
Note the highest Sharpe ratio (risk-adjusted return), albeit only slightly, for the All Weather 2x above, with volatility almost identical to the S&P 500 but with much better Worst Year and Max Drawdown (from the GFC) stats.
Here's a backtest going back to 2006 comparing the 2x All Weather above to the unleveraged All Weather Portfolio, a traditional 60/40 stocks/bonds portfolio, and the S&P 500 index:
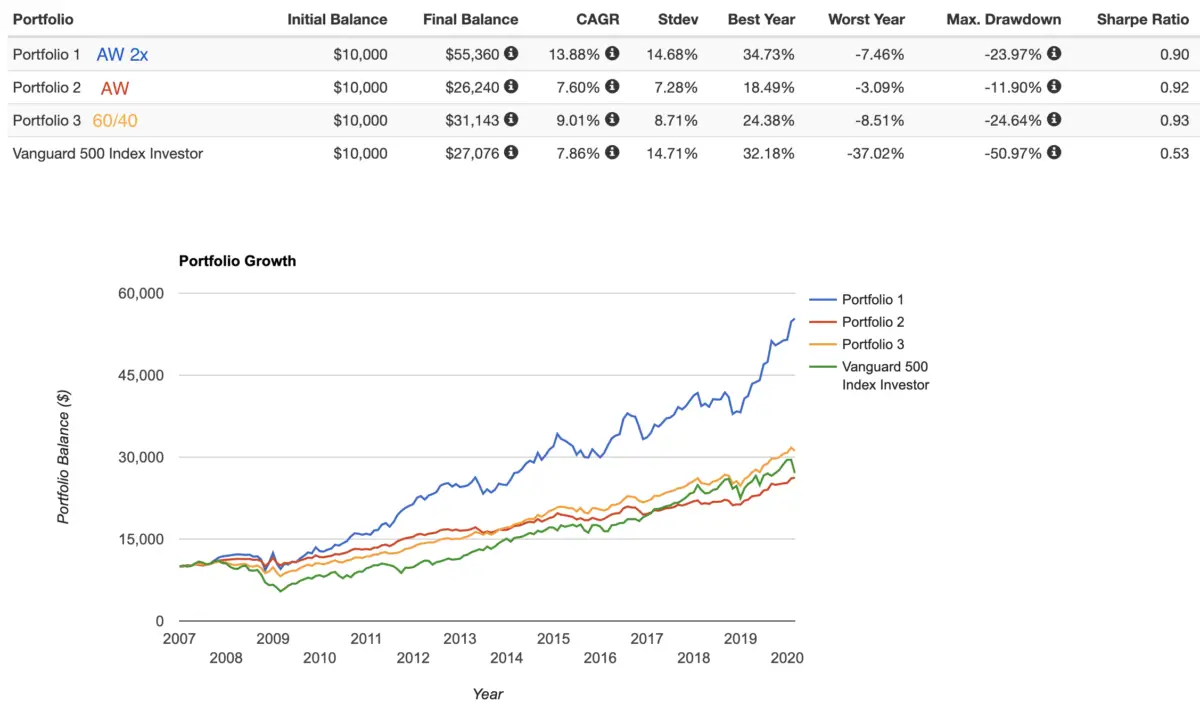
The 60/40 achieves the highest Sharpe but with much lower return than and a nearly identical Worst Year and Max Drawdown to the 2x All Weather.
Update April 2020: After Direxion's changing GUSH from 3x to 2x effective March 31, 2020, I would consider using 3x Utilities, REITs, or Consumer Staples, accessed via UTSL, DRN, and NEED respectively. Unfortunately, at the time of writing, M1 Finance doesn't offer the NEED (3x Consumer Staples) ETF. Below I explain why Utilities are probably the best choice.
3x Leveraged All Weather Portfolio Using Utilities
Here's a pie using UTSL (3x Utilities) in place of broad commodities. Interestingly, this may actually be a better choice anyway considering the backtest below.
30% UPRO – 3x S&P 500
40% TMF – 3x LT treasury
15% TYD – 3x IT treasury
7.5% UTSL – 3x utilities7.5% UGLD – 3x gold
Update June 22, 2020: With the recent market turmoil, Credit Suisse announced today that it plans to delist some of its 3x leveraged VelocityShares™ ETN's, including UGLD. With no other 3x gold funds available, the next logical choice would be UGL, the 2x gold ETF from ProShares. Keep in mind gold is already an extremely volatile asset, so this shouldn't throw anything off too much considering it only has a 7.5% allocation. This will slightly change the allocations of the leveraged risk parity portfolio at the end of this post.
Backtests of leveraged ETFs below are using my own data series I created in an attempt to accurately simulate how these leveraged ETFs – which are relatively new products – would have behaved historically. This factors in their daily resetting, fees, and borrowing costs, so returns shown are net of those things.
The backtest below compares 1x (“normal”), 2x, and 3x versions of the All Weather Portfolio, all using Utilities instead of Commodities and all using 2x gold since a 3x gold ETF is no longer available. It goes back to 1987 and runs though February, 2021:
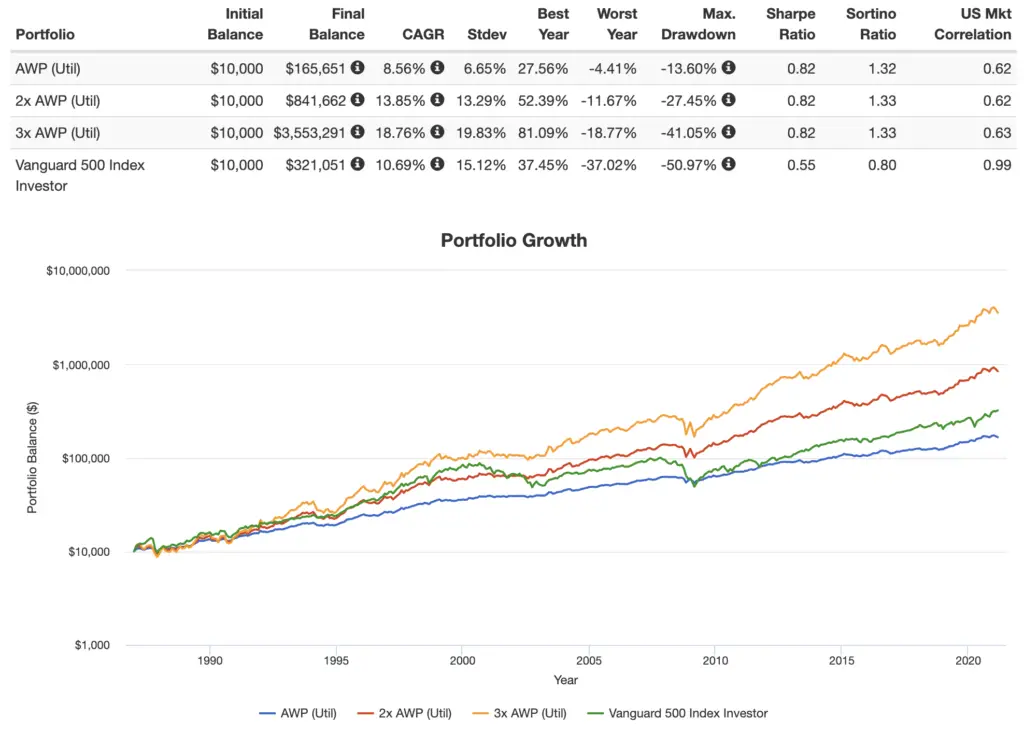
Interestingly, the risk-adjusted return of all of them (Sharpe) was identical, and higher than that of the S&P 500. The 2x and 3x versions of the AWP above have higher general and risk-adjusted returns than the S&P 500, though obviously that came with greater volatility.
2x Leveraged All Weather Portfolio Using Utilities
With the loss of UGLD (3x gold), you may be interested in simply using a 2x All Weather Portfolio. Incorporating Utilities in place of Commodities as described above, we arrive at the following allocations:
SSO – 30%
UBT – 40%
UST – 15%
UPW – 8%
UGL – 7%
You can add this pie to your M1 Finance portfolio here.
True Risk Parity
Update January 2023: Previously I had a section here talking about a “true” risk parity weighting scheme based on the per se volatility of each constituent asset, which is usually what we mean when we say “risk parity.”
After a lot of reflection on this initially innocuous experiment, I realized that interpretation – without trying to – basically bastardizes Dalio’s original idea of using specific assets at specific weights to achieve a rough parity of the risks of the aforementioned economic seasons, for which certain assets span multiple quadrants.
I also concluded it probably didn’t make much practical sense anyway due to the inclusion of multiple funds of the same asset type as independent inputs of an optimization algorithm. Ironically, it would make more sense to do so only after trimming down the fund selection to a single fund for each asset class, but of course at that point we’re talking about another portfolio entirely. In any case, it created a pretty significantly different portfolio, relatively speaking considering the aforementioned seasons-parity thesis underpinning Dalio’s original proposition.
Lastly, it was also confusing for readers not knowing whether or not they should consider what was essentially a theoretical exercise as a viable real-world investment strategy.
For these reasons, I’ve decided to remove that discussion in its entirety. I probably should have never published it in the first place. You can perhaps take solace in the fact that it backtested worse than everything else you see on this page.
Addressing Concerns Over Bonds
I've gotten a lot of questions about the use, utility, and viability of bonds being a significant chunk of the All Weather Portfolio. I'll briefly address and hopefully quell these concerns below.
Common comments nowadays about bonds include:
- “Bonds are useless at low yields!”
- “Bonds are for old people!”
- “Long bonds are too volatile and too susceptible to interest rate risk!”
- “Corporate bonds pay more!”
- “Interest rates can only go up from here! Bonds will be toast!”
- “Bonds return less than stocks!”
So why use bonds?
- Bond duration should be roughly matched to one’s investing horizon, over which time a bond should return its par value plus interest. Betting on “safer,” shorter-term bonds with a duration shorter than your investing horizon could be described as market timing, which we know can’t be done profitably on a consistent basis. This is also a potentially costlier bet, as yields tend to increase as we extend bond duration, and long bonds better counteract stock crashes. More on that in a second.
- Moreover, in regards to bond duration, we know market timing doesn’t work with stocks, so why would we think it works with bonds and interest rates? Bonds have returns and interest payments. A bond’s duration is the point at which price risk and reinvestment risk – the components of what we refer to as a bond’s interest rate risk – are balanced. In this sense, though it may seem counterintuitive, matching bond duration to the investing horizon reduces interest rate risk and inflation risk for the investor. An increase in interest rates and subsequent drop in a bond’s price is price risk. A decrease in interest rates means future coupons are reinvested at the lower rate; this is reinvestment risk. A bond’s duration is an estimate of the precise point at which these two risks balance each other out to zero. If you have a long investing horizon and a short bond duration, you have more reinvestment risk and less price risk. If you have a short investing horizon and a long bond duration, you have less reinvestment risk and more price risk. Purposefully using one of these mismatches in expectation of specific interest rate behavior is intrinsically betting that your prediction of the future is better than the market’s, which should strike you as unlikely.
- It is fundamentally incorrect to say that bonds must necessarily lose money in a rising rate environment. Bonds only suffer from rising interest rates when those rates are rising faster than expected. Bonds handle low and slow rate increases just fine; look at the period of rising interest rates between 1940 and about 1975, where bonds kept rolling at their par and paid that sweet, steady coupon.
- New bonds bought by a bond index fund in a rising rate environment will be bought at the higher rate, while old ones at the previous lower rate are sold off. You're not stuck with the same yield for your entire investing horizon.
- We know that treasury bonds are an objectively superior diversifier alongside stocks compared to corporate bonds. This is also why I don't use the popular total bond market fund BND. It has been noted that this greater degree of uncorrelation between treasury bonds and stocks is conveniently amplified during periods of market turmoil, which researchers referred to as crisis alpha.
- Again, remember we need and want the greater volatility of long-term bonds so that they can more effectively counteract the downward movement of stocks, which are riskier and more volatile than bonds. We're using them to reduce the portfolio's volatility and risk. In short, more volatile assets make better diversifiers. Dalio seems to be one of the few who truly understand this. Designers of many other lazy portfolios are often using short or intermediate bonds, of which the volatility contribution pales in comparison to that of stocks.
- This one's probably the most important. We're not talking about bonds held in isolation, which would probably be a bad investment right now. We're talking about them in the context of a diversified portfolio alongside stocks, for which they are still the usual flight-to-safety asset during stock downturns. Though they admittedly provided a major boost to this strategy's returns over the last 40 years while interest rates were dropping, a low interest rate environment does not suddenly mean bonds stop doing their job. Even if rising rates mean bonds are a comparatively worse diversifier (for stocks) in terms of future expected returns during that period does not mean they are not still the best diversifier to use.
- Similarly, short-term decreases in bond prices do not mean the bonds are not still doing their job of buffering stock downturns.
- Historically, when treasury bonds moved in the same direction as stocks, it was usually up.
- Interest rates are likely to stay low for a while. Also, there’s no reason to expect interest rates to rise just because they are low. People have been claiming “rates can only go up” for the past 20 years or so and they haven't. They have gradually declined for the last 700 years without reversion to the mean. Negative rates aren't out of the question, and we're seeing them used in some foreign countries.
- Bond convexity means their asymmetric risk/return profile favors the upside.
- Long bonds have beaten stocks over the last 20 years. We also know there have been plenty of periods where the market risk factor premium was negative, i.e. 1-month T Bills beat the stock market – the 15 years from 1929 to 1943, the 17 years from 1966-82, and the 13 years from 2000-12. Largely irrelevant, but just some fun stats for people who for some reason think stocks always outperform bonds.
- Again, I acknowledge that post-Volcker monetary policy, resulting in falling interest rates, has driven the particularly stellar returns of the raging bond bull market since 1982, but I also think the Fed and U.S. monetary policy are fundamentally different since the Volcker era, likely allowing us to altogether avoid runaway inflationary environments like the late 1970’s going forward.
David Swensen summed it up nicely in his book Unconventional Success:
“The purity of noncallable, long-term, default-free treasury bonds provides the most powerful diversification to investor portfolios.”
Ok, bonds rant over. If you still feel some dissonance, the next section may offer some solutions.
Reducing Volatility and Drawdowns and Hedging Against Inflation and Rising Rates
It's unlikely that any of the following will improve the total return of the portfolio, and whether or not they'll improve risk-adjusted return is up for debate, but those concerned about inflation, rising rates, volatility, drawdowns, etc. and/or the future ability of long bonds to adequately serve as an insurance parachute may want to diversify a bit further with some of the following options:
- LTPZ – long term TIPS (inflation-linked bonds).
- SCHP – intermediate TIPS.
- VTIP – short TIPS.
- FNCL – financials (banks tend to do well when interest rates rise because they make more money on loans).
- FAS – 3x financials.
- VWO – emerging markets (diversify outside the U.S.).
- EDC – 3x emerging markets.
- EURL – 3x Europe.
- MCHI – China (lowly correlated to the U.S.).
- YINN – 3x China.
- VNQ – REITs (arguable diversification benefit from “real assets”).
- DRN – 3x REITs.
- EDV – U.S. Treasury STRIPS.
- TYD – 3x intermediate treasuries – less interest rate risk.
- UDOW – 3x the Dow – greater loading on Value and Profitability factors than UPRO.
- TNA – 3x Russell 2000 – small caps for the Size factor.
- TAIL – OTM put options ladder to hedge tail risk. Mostly intermediate treasury bonds and TIPS.
I may explore some new backtests with some of these as added diversifiers in the near future.
What we can say about the portfolio's heavy use of bonds is that rising rates would cause lower returns for this portfolio going forward compared to what it's seen in the past, even if the bonds still help reduce volatility and risk. Investors can mitigate that inflation risk by using TIPS, international stocks, and perhaps a nominal bond barbell using long bonds and short bonds (instead of the prescribed long and intermediate), as short bonds are a decent inflation “hedge” since new bonds at higher rates can be rolled faster.
As I've noted, while gold and broad commodities would almost certainly help weather an inflationary period “better” than just stocks and nominal bonds, I don't have as much confidence in them as a true inflation “hedge,” and I'd much rather use other assets like TIPS and short bonds. In fairness, TIPS weren't even around yet when Dalio first proposed the All Weather Portfolio's components.
Optimal Rebalance Interval
Regular rebalancing is necessary with any of these leveraged portfolios, as the leveraged funds will likely quickly stray from their target allocations. Below I've compared the historical metrics from different rebalance intervals (annually, semi-annually, quarterly, and monthly) for the 3x version using Utilities for the period 1987-2019:
| Interval | CAGR | St. Dev. | Max Drawdown | Sharpe |
|---|---|---|---|---|
| Annually | 22.53% | 22.71% | -39.72% | 0.88 |
| Semi-Annually | 22.23% | 21.90% | -38.23% | 0.89 |
| Quarterly | 23.17% | 21.69% | -40.37% | 0.93 |
| Monthly | 22.06% | 21.52% | -44.34% | 0.90 |
As I suspected, quarterly rebalancing performed the best historically by a decent margin, and would probably be the best choice going forward.
Conclusion
Were I to implement any of these leveraged versions, I'd probably go with the “regular” 3x using Utilities, as the risk parity now with UGL doesn't seem worth the trade-off to me, and rebalance quarterly, using M1 Finance. M1 features dynamic rebalancing so it will automatically direct new deposits to maintain your target allocations until the point at which your portfolio value becomes so high that your regular deposits can't keep things in balance (a great problem to have).
Canadians can find the above ETFs on Questrade or Interactive Brokers. Investors outside North America can use Interactive Brokers.
That doesn't mean you should blindly copy it. I'm relatively young with a long investing horizon and a high risk tolerance. As I said earlier, assess your own personal factors before diving into leveraged funds. The assumption of more risk, especially with the use of leverage, gives you the potential for more reward, but also the potential for greater losses.
In any case, one should deleverage as time passes. If you have a shorter time horizon, if you don't have the stomach for leverage (most don't), or if you simply don't care for any of this more complicated leverage stuff, the “normal,” original All Weather Portfolio up at the top is perfectly fine. As I noted, I'd still swap out the commodities for utilities due to my contempt for the former.
Hopefully it goes without saying that all of the above leveraged options are not ideal for a taxable account due to the need for regular rebalancing.
Which one would you choose? Does the recent market turmoil have you reevaluating your true risk tolerance and considering an “all-weather” approach? Let me know what you think in the comments.
Right now M1 is offering a transfer promotion of a 0.50% payout on settled transfers over $10,000 into Invest accounts before January 31 with a max payout of $25,000. Terms for this promotion are here.
Are you nearing or in retirement? Use my link here to get a free holistic financial plan and to take advantage of 25% exclusive savings on financial planning and wealth management services from fiduciary advisors at Retirable to manage your savings, spend smarter, and navigate key decisions.

Disclosures: I am long VWO, TMF, UPRO, and UTSL in my own portfolio.
Interested in more Lazy Portfolios? See the full list here.
Disclaimer: While I love diving into investing-related data and playing around with backtests, this is not financial advice, investing advice, or tax advice. The information on this website is for informational, educational, and entertainment purposes only. Investment products discussed (ETFs, mutual funds, etc.) are for illustrative purposes only. It is not a research report. It is not a recommendation to buy, sell, or otherwise transact in any of the products mentioned. I always attempt to ensure the accuracy of information presented but that accuracy cannot be guaranteed. Do your own due diligence. I mention M1 Finance a lot around here. M1 does not provide investment advice, and this is not an offer or solicitation of an offer, or advice to buy or sell any security, and you are encouraged to consult your personal investment, legal, and tax advisors. Hypothetical examples used, such as historical backtests, do not reflect any specific investments, are for illustrative purposes only, and should not be considered an offer to buy or sell any products. All investing involves risk, including the risk of losing the money you invest. Past performance does not guarantee future results. Opinions are my own and do not represent those of other parties mentioned. Read my lengthier disclaimer here.
Are you nearing or in retirement? Use my link here to get a free holistic financial plan and to take advantage of 25% exclusive savings on financial planning and wealth management services from fiduciary advisors at Retirable to manage your savings, spend smarter, and navigate key decisions.

Thanks for this impressive article, John.
Practically, young investors may rebalance the allocation through cashflow (monthly salary).
In applying this leverage portfolio, what are your opinion regular cashflow investment? Will this affect the performance?
Have a nice day,
Hey KK,
You’re definitely right. I’d guess most investors, myself included, will simply be making regular deposits monthly or biweekly. If you’re using M1 Finance, they feature what they call “dynamic rebalancing” – allocating new deposits to funds based on target weights, buying underweight components. Though you’d still need to monitor any components that become drastically overweighted, in which case a manual rebalance would be necessary to sell.
Excellent stuff John,your blog is amazing ! I felt in love with american blogs
One question
I’m an european investor,so all capital gains or dividends of distributing etfs are taxated at 35% excluding bonds (12.5% taxation)
Is still worth to implement the AW leveraged x3 with utilities ? Would the optimal rebalancing still be quarterly and what would be the true cagr ?
I would like to run a simulation on my own with this data but I can’t put the input in portfolio visualizer
Waiting for some of yours precious tips
Greetings
Thanks Antonio!
Only you can decide if the taxation is worth it. Optimal rebalancing interval should still be quarterly, making it not ideal for a taxable account. Something like NTSX may be better suited to get some enhanced exposure in a taxable account in your situation. I mentioned it briefly in my post on the Hedgefundie Adventure.
You can backtest yourself with PV using leveraged percentages on unleveraged funds and a negative cash position to extend the backtest to an earlier date.
Wow, John! Very well written article with lots of great data and context to support it. I’ve been trading this way since October of last year, and the results have been impressive–even through the crazy volatility caused by COVID-19. I started trading this way shortly after reading Tony Robbins’ book and doing a ton of back testing of my own on Quantopian. I haven’t been using utilities like you mention, but I think it makes a ton of sense. I plan on reallocating my commodities to utilities as soon as the markets open. One thing I’ve done slightly differently that I’ve found to make a big impact is use a rebalance band of 10% rather than a time-based interval. I’ve written a python script that constantly monitors my portfolio allocation and sends me a text message when my aggregate portfolio imbalance is above 10%. I’ve found that this allows me to capture a lot more volatility than I otherwise would with time-based rebalance intervals. Just wanted to share in case you find it valuable.
Thanks for the kind words, Zack.
Yea you could definitely employ some different rebalancing strategies. I figured things like bands and volatility targeting would be a bit too advanced for the average investor. I’m personally using monthly volatility targeting with the Hedgefundie Adventure.
Thanks for sharing.
Hi John,
I am here to comment again:) I learned a lot by reading your post and thank you again for doing this!
I thought over and over about investing into the leverage AWP X2 or X3 portfolio and I am still a little bit confused on how the 2X or 3X treasury fund works? Can you explain a bit more on how these funds work? Also, as the yield curve gets inverted, how they could manage the fund without borrowing at a higher short term rate?
What are the potential risks for these funds?
Thanks always!
Hey again Grace.
Those funds just aim to deliver 2x or 3x the returns of the underlying index. They’re usually using swaps to do so. Their prospectuses would have more accurate and more detailed information than I could provide. You can find those on the fund’s website.
Risks include the obvious general risks and volatility decay associated with using leverage, and then just the same risks that would accompany holding unleveraged treasury bond funds: the risk that treasuries fall with stocks, liquidity risk, counterparty risk, rising interest rates, hyperinflation, etc.
Hello John
This is article is awesome, thank you for writing it.
I want to backtest the regular AW x3 using utilities, but as some comments mention, portfolio visualizer constraints the time period due to UTSL, which is only available from Jun 2017, after manually leveraging XLU then UPRO is the problem, being only available from Jul 2009.
Could you please show us the allocations you used for backtesting purposes? because I find that manually leveraging diverts from your strategy.
Please consider this as I am seriously considering investing in this portfolio.
Hey Jonathan,
Thanks for saying that! I’m glad you found it interesting.
Sorry for the confusion. You can just use all 1x “normal” ETF’s at 300% allocations with a negative cash position in Portfolio Visualizer to do it. Basically you just want to find the oldest funds available for each asset. For example, SPY – the popular S&P 500 ETF – goes back to 1993, which is great, but we can use the Vanguard S&P 500 mutual fund VFINX to go back even further. So in the case of the 3x, it would look like this. Note that I used 2x gold since we can no longer use UGLD.
Hope that makes sense. Let me know if I can clarify it further for you.
Hi John,
Thanks for the great articles. I’ve been learning a lot on your website.
What’s your opinion on using any of those portfolios in multiple registered accounts? Let’s say you would consider starting one, and most of your money is split between a RRSP and a TFSA, with some taxable.
Would you take the same allocations of your chosen strategy and implement it in every account? Or you would choose one account for each ETF?
Thanks!
Marc,
Thanks for the kind words! I’m really glad you’ve been finding them useful.
Always view your portfolio as a whole, instead of individual buckets. A caveat would be if, for example, you plan to use money invested in a taxable account in 10 years or so, compared to a 30-year time horizon for retirement accounts. Ideally, segment assets across accounts based on tax-efficiency, e.g. Growth stocks in taxable and bond funds in tax-advantaged accounts. Admittedly I’m not too familiar with Canadian accounts, but Vanguard has a good page here on the sliding scale of tax-efficiency of asset types. You’d also probably want to try to avoid using the exact same ETF’s across taxable and tax-advantaged accounts in case you want to harvest losses in the taxable account.
Hope this helps!
John,
I’ve been researching and considering exactly what you’ve posted here, I happened to find your post from a Google search while looking to see if anyone else was of the same mindset (eg. Leverage + All Weather as a retail investor). I’m pretty much coming at it with the same point of view as you (and similarly, no formal background, but I’ve been studying this from pure interest/curiosity for awhile), as I was reading I began to wonder whether I had I sleeped walked to the computer one night and wrote this blog post. It was a “do I have a twin I was separated at birth from?” moment. I’d be interested in bouncing a few additional ideas off of you. Before I noticed there was a comment section I immediately sent you a LinkedIn connection request, so that one from Adam, it’s me. I have to run but I wanted quickly introduce myself as a placeholder for following up, hopefully in the next few days. If you want, email me (or LinkedIn) and I can send you the version/theory relating to this exact scenario that I’ve been kicking around for some time now.
Adam, thanks for your comment. That’s a funny one. I don’t check LinkedIn as often as I should but I’ll go accept your request on there now.
Hi John! This is a very comprehensive article and thank you very much for writing it! I saw you stated this is not ideal for a taxable account. What do you suggest me to do if I have a taxable account? Currently, there is some cash in there and earning very little interest. Also, do you recommend to invest now or wait a bit after the financial turmoil? I know it is very hard to time the market but I would like to see your thoughts!
Thanks a lot!
Hi Grace,
Thanks for the kind words and for your comment!
It would depend on the time horizon for that money in your taxable account. I’m always of the mind that people need an emergency fund in a plain ol’ savings account first. You could put it in a total U.S. market index fund like VTI (or VT for total world) and/or VGIT for intermediate treasury bonds, as interest from treasury bonds is tax-free at the state level. If you have a broker like M1 Finance that uses dynamic rebalancing – where new deposits go toward underweight holdings – you’d be fine using the “normal,” unleveraged All Weather Portfolio in taxable, because new deposits can at least keep the allocations somewhat on track without selling and incurring capital gains taxes.
If you’re wanting to employ leverage in taxable, check out NTSX. It was built with tax efficiency in mind. It’s essentially 1.5x a traditional 60/40 portfolio, making it effectively 90/60.
And I’d suggest not trying to time the market. It is usually more harmful than helpful. Will we see another crash? Maybe. No one knows. We might see steady gains that you’d miss out on waiting on the sideline to get back in.
Hope this helps.
John,
Thank you very much for your response! I am living in Texas which does not charge for state income tax, but I do need to pay taxes for the treasury’s interest. I am wondering is there a way that we can substitute the treasury with municipal bonds? If so how will the return be impacted?
Also, I was trying to use Portfolio Visualizer to backtest the X2 model for AWP. It seems like a very unique portfolio and balanced out risk and return. It is my first time using this software. After I put UBT and UST, it does not allow me to backtest to 2006. Could you help me to know how you did that?
Thanks a lot!
Grace
Ah gotcha. Muni bonds usually only offer a benefit for very high income individuals and I wouldn’t consider them a direct replacement for treasury bonds; they are more correlated to the market than treasury bonds. Local governments have also been pretty volatile recently, so I wouldn’t want my entire bond position in munis.
To simulate a constant leverage ratio in PV, I just used “normal,” unleveraged versions of those funds at the leveraged exposure and then put in a negative cash position to compensate, like this for 3x 60/40.
Thanks a lot! That is very helpful!
Grace
Hi, thanks for the great article!
I just tried to use Portfolio Visualizer to run the test as you did in this article. However I found that the data for UTSL is only available from Jun 2017. May I know how did you get the results from 2006 to 2019 since PV doesn’t allow that range due to the UTSL data availability. Thanks!
Hey Max,
For some of the backtests I just used the utilities fund XLU, levered up the allocation percentage, and put in a negative cash position to offset.
Risk parity is now also available pre-packaged as an ETF – RPAR
Interesting ETF but not the same thing as the All Weather Portfolio.
I finally got around to reviewing the RPAR ETF here.
John,
I love your articles! With all these portfolios to pick from, which one do you thinks is best for a retiree who has little stomach for losses? I don’t think leverage is for me. It seems like the Golden Butterfly is best, but then you substitute utilities for commodities on the All Weather and it looks like it might be better, and then you “add” parity. How do I choose?
Thanks!
Tom, thanks for the kind words and for your comment!
You’re right, leverage probably shouldn’t be used in retirement. Personally, I like the All Weather over the Golden Butterfly with its much lower allocation to gold. I created a backtest for you here that goes back to 1999 comparing those 3 options. Portfolio 1 is the All Weather Portfolio with Utilities. Portfolio 2 is the Golden Butterfly. Portfolio 3 is a risk parity All Weather with Utilities. Note the slightly larger volatility and drawdowns – and subsequently lower Sharpe – for the Golden Butterfly. Their CAGR has been pretty close. But as a retiree, I’d be looking to minimize volatility, so I’d be inclined to look to intermediate treasury bonds in a bond heavy portfolio, and I’d want to use lower volatility large cap stocks instead of small caps, thus the risk parity All Weather would be my choice out of those 3.
Thanks for the response John, and the link. Right now 50% of my portfolio is in a 4 year CD ladder first coming due in 11/20 and the 4th coming due in 11/23. Could I just invest the other 50% in VTSMX, XLU, and GOLD and then as the CDs come due put them in VUSTX and VFITX?
Or will that defeat the purpose of the mix?
Do you have a preference of using funds over the ETF equivalents?
Thanks again!
Tom
Using just VTSMX, XLU, and Gold sounds like a weird mix to start out with. Why not just use the whole AWP and then deposit more into it once your CDs are done?
ETF’s and mutual funds are largely equal nowadays. Just go with whichever is most available to you. ETF’s would have lower minimums and allow for a little more price control.
Thanks! Great idea!
Hi John, thanks a lot for your post!
Just got a couple questions:
1) Is the performance shown before or after fees?
2) The leveraged portfolios seems to have a higher expense ratio. How does the portfolios of leveraged vs non leveraged compare in terms of performance after fees?
3) What would be your preferred lazy portfolio and personal approach to investing?
Thanks
Justin
Hi Justin,
Thanks for your comment.
1. Performance shown includes fees.
2. See #1. The leverage usually more than makes up for its ER.
3. I answered that in another comment here.
If I use EDV instead of TLT
Is it 1.5 TLT ? Or more? Thank you
Hi Eric, yes EDV is 1.5x TLT. Just note that EDV (STRIPS) is not one of the specified assets of the All Weather Portfolio and its use would throw off any risk parity allocations I laid out above.
Great share !!! thanks !!!
How is the true risk parity weightings calculated?
(VGLT – 15%、VTI – 20%、VGIT – 40%、VPU – 13%、IAU – 12%)
Can you teach us how to calculate?
Thank you
Hi Eric,
Risk parity just looks at historical volatility and allocates each asset based on an equal contribution to the whole portfolio – the levels at which “parity” is achieved for each asset’s “risk.”
Hi John
Thanks, my question is why the true risk parity weightings is different from the usual
(VGLT – 40%、VTI – 30%、VGIT – 15%、VPU – 7.5%、IAU – 7.5%)
Is there any special reason? Want to know the reason for the change and how it is calculated (weight)
Like I pointed out, the “original” Robbins AWP is not really based on risk parity weightings. We can use the S&P 500 (VOO) and long-term treasury bonds (VGLT) as a simplistic example. The historical volatility of the S&P 500 has been about 15%. For LTT, about 10%. So we achieve parity at 40/60 VOO/VGLT, where each side is contributing 6%.
Hello, thank you for the information.
I would like to know if it is the same to buy a Bond ETF to buying an actual bond. Which is best?
Because in the book MONEY, Ray Dalio doesn´t specify, he just say that we should buy 40% US Treasury Long Term Bonds.
The other question: which is the difference between an ETF and an Index Fund? Can I buy both? Warren Buffet recomends buying Index Funds, so should I buy Index Fund or an ETF (of the S&P 500 for example)?
Hey Cristóbal,
Thanks for your comment. Bond funds contain individual bonds. No need to buy individual bonds unless you specifically want to for some reason. ETF’s are almost always index funds. They’re one and the same.
Great sharing!John
Come with appreciation
I am still new in All Weather. Please bear with me to I ask 2 basic Questions:
1.How to do the regular rebalancing with these leveraged portfolios?
2. Where I can find the real time historical volatility in each position?
Many thanks
Johnny
Thanks Johnny.
1. If you use a quarterly rebalance, for example, you’d just mark a day on your calendar every 3 months and adjust your holdings to their target allocations. Admittedly this may be easier said than done with traditional brokerages; I’m honestly not sure if platforms like Schwab, Fidelity, etc. have made it easier to rebalance in recent years. I use M1 Finance which has a one-click “Rebalance” button.
2. Any financial website with stock metrics should have volatility. Or you can use Portfolio Visualizer.
John, thank you for the great research – I am a young investor that is seriously considering the x2 leveraged AW with utilities. However, the page did not offer a x2 levered utilities. Any suggestions towards which x2 utilities to choose from?
Also, based on my circumstances I have decided to take a risk with an AW x2 w/ utilities (if possible) for a smaller investment account that I have. Let me know what you think! Thanks!
Anytime, Shane. Thanks for the kind words.
You could use the 3x at a lower allocation, combined with a “normal” 1x to achieve the leverage ratio you desire with lower fees than if you were to do 100% 2x funds. If you want to go that route though, you can use:
SSO
UBT
UST
UPW
UGL
If you have access to CFD you can trade the direct stock using 10~20 x Leverage. That way your not substituting for other products.
True, Alan, though I’d imagine most investors interested in the All Weather Portfolio don’t want that degree of leverage. CFD is also not available in the USA though, and I’d probably be concerned about liquidity. Options and futures may be preferable to CFD.
This is awesome! I could very well be wrong but I think they’re only leveraging the long-term bonds in the Bridgewater All Weather so that the fixed-income risk matches equities risk. What do you think?
https://www.bridgewater.com/resources/our-thoughts-about-risk-parity-and-all-weather.pdf
Chris, thanks for your comment.
That’s incorrect. It sounds like you might be confusing leverage with just being bond-heavy or having a longer bond duration. The proposed All Weather Portfolio is indeed bond-heavy (in both the Tony Robbins version and in my calculation of its risk-parity counterpart). The Tony Robbins version is heavier on long-term bonds while the risk parity version is heavier on intermediate-term bonds. But in either case, you’d want to apply leverage to the portfolio as a whole, to all the assets equally, otherwise their target intra-portfolio allocations relative to each other – and especially risk parity – go out the window.
John, I just started reading your posts and can’t say enough good things about your website. In reading your lazy portfolio reviews I’ve learned a lot. Which lazy portfolio is your personal favorite and/or what is your personal allocation? I saw you allude that one was similar to your portfolio but I’d love to know the specifics. Thanks for your information!
Rob,
Thanks so much for the kind words and for your comment. It makes all the time and effort I put into posts like these feel worthwhile, so I’m really glad to know you’ve been able to learn a thing or two from them.
I get asked that question a lot actually. It’s a seemingly simple question with a not-so-simple answer. It largely comes down to one’s time horizon, risk tolerance, goals, and desired level of effort, so it’s hard to have a “favorite” since there’s no one-size-fits-all answer.
Note that “lazy portfolios” are exactly that – designed to allow the investor to not have to think about or change the asset allocation as time goes on. This “lazy” aspect may indeed be extremely valuable for an investor who truly wants to be completely hands-off and not waste any mental energy thinking about their portfolio, but in some cases that very aspect may appear suboptimal to an experienced investor.
The Couch Potato Portfolio is perhaps the best example of this – 2 assets held in equal allocations. It’s probably the laziest of the lazy portfolios, being on the no-mental-energy-required end of the spectrum. And again, that aspect may very well be extremely valuable to the investor. I think that’s perfectly valid and I can’t argue against it.
I would suggest that on the other end of that spectrum are lazy portfolios like the Larry Swedroe Portfolio, Tim Maurer’s Simple Money Portfolio, and Paul Merriman’s Ultimate Buy and Hold Portfolio. My portfolio most closely resembles these. These portfolios utilize Size and Value tilts, which I personally agree with and believe in (while also acknowledging I could be wrong). I’m a somewhat seasoned investor so I know what those things mean. Many investors, though, won’t know what Size and Value tilts are, and more importantly, may not care to know. In those cases, they may shy away from those portfolios because of that fact, and perhaps they should. I can’t argue with that either. Different ends of that sliding scale of simplicity and “laziness” may capture different audiences.
I think that same sliding scale may also coincide somewhat with risk tolerance. Some investors consciously want a low-risk, low-volatility, stable portfolio, in which case something like the All Weather or Golden Butterfly would likely serve them best. Again, that stability likely comes at the cost of lower long-term total returns, but this tradeoff may be perfectly acceptable to the investor.
I would argue that somewhere in between those two ends of the spectrum are portfolios like the Bogleheads 3-Fund and the traditional stalwart 60/40. These become less lazy – and I would suggest, improved – when you start tinkering with bond durations. Even with the Bogleheads 3 Fund Portfolio, one still has to assess their risk tolerance and choose a corresponding asset allocation. With the 60/40, we’d have to start talking about whether or not to incorporate international stocks, what bond duration to choose, etc. These extra steps, while minimal, make them less “lazy” in my opinion.
Because of those facts, and because I don’t want to broadly advise a Value bet to people who may not even know what is, were I forced to blindly suggest a one-size-fits-most lazy portfolio that is truly lazy, it would probably have to be the “moderate” version of the Rick Ferri Core 4 Portfolio. It takes a traditional 60/40, applies international diversification for equities, and adds a dash of extra REITs. If one is willing to put in a little more effort to assess their risk tolerance and choose an asset allocation, I’d pick the Bogleheads 3 Fund Portfolio.
Maybe I’ll do a post in the future about how exactly I invest my own money.
Hope this helps, Rob. Sorry for the long-winded answer.
Rob, finally got around to writing up my own portfolio.
Hi John
Thanks for the article – very informative and really enjoyed it. If you read the Bridgewater paper on “The All Weather Story,” on of the things they talk about is inflation-linked bonds and the important role they play. Any thoughts on how you could incorporate these into the portfolio. I know Vanguard only has a short duration TIPS ETF, which likely isn’t suitable for inclusion, though their funds are more intermediate in duration.
Thanks!
Carl,
Thanks so much for the kind words and for your comment. I’m really glad you enjoyed the post and found it informative.
You’re right. The “real” All-Weather strategy from Bridgewater for institutional investors employs a broader range of assets that includes inflation-linked bonds. The Tony Robbins “retail” version above essentially uses gold and broad commodities as a proposed inflation hedge. As for whether or not they will actually provide that protection in the future remains to be seen.
I think the inclusion of TIPS, like most things, comes down to the investor’s goals, time horizon, and risk tolerance. Including TIPS is a perfectly sensible idea if the investor wants more stability and lower volatility, but their inclusion would also likely drag down long-term total return. So it’s somewhat of a trade-off. As with most assets of that nature, I think their inclusion becomes more attractive and necessary as one nears and enters retirement.
To my knowledge, there’s no leveraged TIPS ETF product, so the leveraged strategies above would be out the window somewhat.
As I noted, I’m not a big fan of gold or commodities to begin with, so in a “regular” unleveraged All Weather Portfolio, I’d be tempted to let TIPS use at least some of their allocation or even replace them entirely. The $TIP ETF from iShares is the highest-AUM product in the category. $SPIP from SPDR should be comparable and would save you a little on fees. A small extra allocation dedicated to REITs may also be prudent if one desires inflation protection.
That said, I also believe that post-Volcker (1982) U.S. monetary policy is a fundamentally different beast that will hopefully allow us to avoid hyperinflationary environments like the late 1970’s altogether going forward. That is, TIPS and other proposed inflation hedges hopefully won’t be as necessary as they once were.
Thanks for the discussion-provoking comment. I hope this helps.
I like the presentation, nice and clear.
A quick note on rebalancing frequency. I wrote some code to systematically check performance from different starting dates. I’ve found that portfolio visualizer lines up calculations with the ends of months and quarters. When I do all possible starting dates, I’ve found that the beginning/ends of months and quarters tend to do better than other starting points, sometimes significantly. Part of this is the luck of timing with respect to big events, but part seems to be systematic differences.
So the recommendation might be a bit more nuanced than just picking a quarterly/monthly interval.
Thanks Stuart.
That’s interesting, and I guess that makes sense. It’s probably easiest for most people to pick a specific day of the month – maybe it’s the first day of the month – and put it on the calendar to use that same day each time.
using levered ETF is a very bad idea, they are designed for short term trades. buy and hold will lead to structural losses (too long to explain here but you can google). most efficient way to lever it up for small investors is to do the equity portion using micro futures (S&P, Nikkei, DJ 600 Europe etc). If your portfolio is decent size levering the bond side with futures is a must in terms of efficiency.
Mario, thanks for your comment.
Yes, there’s no shortage of articles lambasting the idea of holding leveraged ETF’s for more than one day and reciting that they should “only be used for intraday trading.”
But I would submit that the idea that leveraged ETF’s are unsuitable for long-term holding is largely overblown fear mongering that’s been wrongly perpetuated after the financial blogosphere took the scary-sounding “volatility decay” and ran with it.
“Volatility decay” sounds like a bad thing, but viewing it as such is simply a misunderstanding of what it actually is and its underlying mechanics and arithmetic. That same “decay” actually works in your favor when the market goes up with decent momentum, which it does more than it goes down. The current market turmoil aside, this is why UPRO, the 3x leveraged S&P ETF, has delivered close to 5x the returns of the SPX since its inception instead of the proposed 3x.
I would encourage you to read this page: http://www.ddnum.com/articles/leveragedETFs.php
We’re also implicitly assuming the leverage-driven outperformance will more than pay for the fees and borrowing costs of the ETF’s. I completely agree that the use of futures is likely a more efficient execution of a leveraged strategy, but that’s a steep learning curve and a lot more effort for the average DIY retail investor, especially with the multiple assets in the All Weather Portfolio.
Hi John,
Great article and good information. Thanks for writing it.
Have a couple of questions regarding the “True Risk Parity” portfolio using the Vanguard funds.
I noticed the Vanguard funds are not (leveraged) 3 times the market like in the “3X Leveraged All Weather Portfolio Using Utilities” are. But yet the returns are just a little less (about 50K) with less volatility for the “True Risk Parity” portfolio. Do I understand this correctly?
Also, how many times per year would be wise to re-balance the “True Risk Parity” portfolio?
Thanks
Hey Del, thanks for the kind words and for your comment.
The funds I listed for the risk parity version aren’t leveraged. The screenshot of the backtest is using 3x leveraged funds though. I think I’ll edit that section to be more clear. I do have a link for the leveraged version of that portfolio to use on M1 Finance. You would just need to use the corresponding leveraged funds at those same allocations:
TMF – 15%
UPRO – 20%
TYD – 40%
UTSL – 13%
UGLD – 12%
I’d think quarterly rebalancing would be prudent, as the leveraged funds may quickly stray from their target allocations. I’ll see if I can whip up some historical comparisons of different rebalancing intervals.
Hope this helps!
Hey Del,
Just made that section more clear and added a table comparing different rebalancing intervals. I’d go with quarterly rebalancing.
TECL and TQQQ / TMF both work great, and I may switch to TQQQ because I have it in the levered All Weather, one less ETF to track.
Do some backtesting with and without Gold, I don’t think you’ll be disappointed – returns are not bad and it lowers volatility.
Check out the TAA strategy of mine that I also use for about half of my portfolio:
The Russell: https://tinyurl.com/yam6fmf3
Only difference is the LTT are a little volatile for me, I show it with VFITX as the Rick Off option because it has more history, but I actually use PLW for my Risk Off holding.
Hi John,
I see we ended up on two similar threads from Bogleheads. I am also allocating to a variant of HedgFundie’s Great Adventure (in a TECL/TMF Adaptive Allocation manner.)
And I too ended up with a levered All Weather/PSDLX type allocation. My allocation is most similar to your Risk Parity version, I’ve implemented it and am running it gladly so far.
Unlike yours, I don’t lever up the Gold and Utilities, I leave them at 1X, I’ve labeled mine “All Weather 175” and “All Weather 250” because the total net leverage is 175% or 250% depending on which version is used.
Here’s the Portfolio Visualizer link to my versions, https://tinyurl.com/ybhqo8zl
Keep up the faith!
Randy, thanks for the comment!
Between PSLDX, NTSX, UTSL, and Hedgefundie’s UPRO/TMF, it’s starting to feel like I’ve got a lot of little “adventures” going in my portfolio. Thanks for sharing yours.
I don’t employ any of the above AW portfolios myself. I did it mostly for fun; I’m not at all a fan of gold, but I’m sure many investors are turning to more All-Weather-type portfolios now after realizing their true tolerance for risk in these tumultuous times.
Interesting that you’re going with TECL. Did you consider using TQQQ instead since it’s mostly tech? Or simply overweighting tech in UPRO with a small TECL allocation?
– John