• Skip to main content
  • Skip to secondary menu
  • Skip to primary sidebar
  • Skip to footer

Optimized Portfolio

Investing and Personal Finance

  • Start Here
  • Investing 101
    • Beginners Start Here – 10 Steps To Start Building Wealth
    • What Is the Stock Market? How It Works & How to Invest in It
    • How To Invest in an Index Fund – The Best Index Funds
    • Portfolio Asset Allocation by Age
    • How To Invest Your Emergency Fund
    • Portfolio Diversification – How To Diversify Your Portfolio
    • Dollar Cost Averaging vs. Lump Sum Investing (DCA vs. LSI)
    • How To Invest Your HSA (Health Savings Account)
    • Factor Investing and Factor ETFs – The Ultimate Guide
    • more…
  • Lazy Portfolios
    • All Weather Portfolio
    • Bogleheads 3 Fund Portfolio
    • HEDGEFUNDIE’s Excellent Adventure
    • Warren Buffett Portfolio
    • Golden Butterfly Portfolio
    • Paul Merriman Ultimate Buy and Hold Portfolio
    • Ben Felix Model Portfolio
    • Permanent Portfolio
    • David Swensen Portfolio
    • 60/40 Portfolio
    • more…
  • Funds
    • VOO vs. VTI – Vanguard S&P 500 or Total Stock Market ETF?
    • The 7 Best International ETFs
    • The 8 Best Small Cap ETFs (4 From Vanguard)
    • The 5 Best REIT ETFs
    • The 5 Best EV ETFs – Electric Vehicles ETFs
    • VIG vs. VYM – Comparing Vanguard’s 2 Popular Dividend ETF’s
    • The Best Vanguard Dividend Funds – 4 Popular ETFs
    • The 5 Best Tech ETFs
    • The 7 Best Small Cap Value ETFs
    • The 6 Best ETFs for Taxable Accounts
    • The 5 Best Emerging Markets ETFs (1 From Vanguard) for 2023
    • more…
  • Leverage
    • What Is a Leveraged ETF and How Do They Work?
    • How To Beat the Market Using Leverage and Index Investing
    • The 9 Best Leveraged ETFs
    • Hedgefundie’s Excellent Adventure
    • Leveraged All Weather Portfolio
    • Leveraged Permanent Portfolio
    • Leveraged Golden Butterfly Portfolio
    • NTSX – Review and Summary
    • TQQQ – Is It A Good Investment?
    • PSLDX – A Review
    • SWAN – A Review
    • RPAR Risk Parity ETF Review
    • more…
  • Dividends
    • The Best M1 Finance Dividend Pie
    • The 11 Best Dividend ETFs
    • The Best Vanguard Dividend Funds – 4 Popular ETFs
    • VIG vs. VYM – Comparing Vanguard’s 2 Popular Dividend ETF’s
    • 8 Reasons Why I’m Not a Dividend Income Investor
    • QYLD – A Harsh Review
    • more…
  • Brokers
    • The 5 Best Stock Brokers
    • The 4 Best Investing Apps
    • M1 Finance Review
    • Brokers with the Lowest Margin Rates
    • M1 Finance vs. Fidelity
    • M1 Finance vs. Vanguard
    • Webull vs. Robinhood
    • Stash vs. Robinhood
    • M1 Borrow Review (How M1’s Margin Loan Works)
    • more…
  • Retirement
    • The 10 Best ETFs for Retirement Portfolios in 2023
    • The 4% Rule for Retirement Withdrawal Rate – A Revisitation
    • Sequence of Return Risk in Retirement Explained
    • Traditional IRA Explained
    • Roth IRA Explained
    • 401k vs. Roth IRA
    • Roth IRA vs. Traditional IRA
    • Backdoor Roth IRA Explained
    • more…
  • My Toolbox
    • Calculators

VOO vs VOOG vs VOOV – Vanguard S&P 500, Growth, or Value?

Last Updated: May 9, 2026 9 Comments – 8 min. read

While these 3 ETFs from Vanguard look very similar based on their tickers, they are in fact very different. Here I explore VOO, VOOG, and VOOV.

In a hurry? Here are the highlights:

  • VOO, VOOG, and VOOV are all popular index funds from Vanguard.
  • VOO tracks the S&P 500 Index. VOOG tracks the S&P 500 Growth Index. VOOV tracks the S&P 500 Value Index.
  • That is, VOOG is roughly half of VOO, and VOOV is the other half.
  • All 3 funds have some overlap, but there exist major differences among them.
  • VOOG and VOOV are more expensive than VOO.
  • At the time of writing, the market already tilts Growth.
  • VOOG has outperformed in recent years, though we would expect VOOV to win out over the long term.
  • VOOV is objectively not the best fund to specifically target large cap value stocks.

Contents

  • VOO vs VOOG vs VOOV – Quick Stats Comparison Table
  • Video
  • VOO vs VOOG vs VOOV – Methodology
  • VOO, VOOG, and VOOV Overlap
  • VOO vs VOOG vs VOOV – Historical Performance
  • VOO vs VOOG vs VOOV – Sector Breakdown
  • VOO vs VOOG vs VOOV – AUM and Fees
  • Conclusion

VOO vs VOOG vs VOOV – Quick Stats Comparison Table

Before we get into the details, here's a comparison table for the quick stats on VOO vs. VOOG vs. VOOV:

MetricVOOVOOGVOOV
NameVanguard S&P 500 ETFVanguard S&P 500 Growth ETFVanguard S&P 500 Value ETF
IssuerVanguardVanguardVanguard
IndexS&P 500S&P 500 GrowthS&P 500 Value
StyleLarge-cap blendLarge-cap growthLarge-cap value
Expense Ratio0.03%0.07%0.07%
AUM (ETF)$839B$22B$6B
Holdings504140444
Top 10 Holdings Weight41%65%23%
Tech Sector Weight34.4%48.8%17.9%
P/E Ratio28.435.123.1
Dividend Yield1.2%0.5%1.8%
Annual Turnover2.3%20.1%32.0%
InceptionSept 7, 2010Sept 7, 2010Sept 7, 2010

Data as of April 2026.

Here's that same comparison table as an image if you want to save or share:

voo vs voog vs voov comparison table

Data as of April 2026.

Video

Prefer video? Watch it here:

VOO vs VOOG vs VOOV – Methodology

If you've arrived on this page, you likely already know that stocks are a significant driver of portfolio performance, that index funds are a great way to get immediate diversification, and that Vanguard has some of the best, cheapest index funds around. Three such index funds from Vanguard are VOO, VOOG, and VOOV.

First let's talk about VOO. The Vanguard S&P 500 ETF launched in 2010, and is one of the most popular stock ETFs in existence. The fund seeks to track the famous S&P 500 Index, which is composed of the 500 largest U.S. companies. This index is considered a sufficient proxy and barometer for “the market” in the U.S. because it spans all sectors and is about 82% of the total U.S. stock market by weight.

Now let's talk about VOOV. The addition of the letter “V” is for Value. The name of this fund is the Vanguard S&P 500 Value ETF. Appropriately, it seeks to track the S&P 500 Value Index.

As the name suggests, this fund selects Value stocks – stocks that are thought to be underpriced based on their fundamental valuation metrics – from the S&P 500. That is, this fund holds roughly half of the S&P 500. Put another way, VOOV is about half of VOO.

So we would call VOOV a “large cap value” fund. These stocks are usually relatively boring and have an established business model with significant market penetration. Value-heavy sectors include Utilities, Financials, REITs, and Consumer Staples. Notable examples include Bank of America, Ford, Disney, Verizon, and Johnson & Johnson.

Value stocks have outperformed Growth stocks historically and are considered riskier. I wrote a separate post about tracking down the best Value ETFs. It's worth noting that VOOV doesn't actually provide great exposure to the actual Value factor compared to its competitors, and it has a lot of overlap with its parent index.

The other half of VOO is, you guessed it, VOOG. The “G” is for Growth. The fund's index is the S&P 500 Growth Index.

This is the other style of stocks – Growth stocks. These stocks trade based on the future potential earnings of the company. They typically reinvest their earnings into new technology, equipment, research, etc.

We call VOOG a “large cap growth” fund. This segment crushed the market for the decade 2010-2019, thanks largely to the stellar run by Big Tech. Growth stocks make the headlines. Notable examples include Apple, Amazon, Google, Facebook, and Tesla.

In summary, the differences here are the fundamental styles of stocks that each of these funds aims to hold – Blend, Value, and Growth.

I said half of VOO is VOOG and the other half is VOOV, but in the interest of full disclosure, the math isn't quite that clean for these specific funds. Because some growth stocks can exhibit value characteristics and vice versa, and because of the way S&P constructs their indexes, all 3 of these funds actually have some overlap. Here's how it shakes out:

  • VOOG makes up about 65% of VOO by weight, meaning the market already currently tilts Growth.
  • VOOV makes up about 60% of VOO by weight.
  • VOOV and VOOG have about 30% overlap by weight.

I'll explain exactly how this happens in the next section.

If you're a visual learner, I made a very crude Venn diagram to illustrate those differences and overlap:

voo voog voov overlap venn diagram differences

Let's talk details about that overlap specifically…

VOO, VOOG, and VOOV Overlap

I hinted at “the way S&P constructs their indexes” being the source of overlap here for VOO, VOOG, and VOOV. Allow me to explain.

S&P doesn't treat Growth and Value as opposites, as we typically do. They treat them as two independent dimensions, which means, in their eyes and via their methodologies, a stock can simultaneously exhibit growth and value characteristics. Here's how it works with respect to VOOG and VOOV:

  1. Every S&P 500 stock gets scored on 3 growth factors (3-year EPS change/price, 3-year sales-per-share growth, 12-month price momentum) and 3 value factors (book/price, earnings/price, sales/price).
  2. Stocks are ranked on the composite growth-to-value score. The top third by market cap go entirely into the Growth index, the bottom third go entirely into Value, and the middle third get split proportionally between both indexes.
  3. The result is roughly 30% of S&P 500 market cap appears in both VOOG and VOOV simultaneously.

The practical downstream effect of all that is stocks like Apple, Amazon, Berkshire Hathaway, and JPMorgan Chase have all appeared in both the growth and value indexes at the same time. As of the most recent data, for example, Apple is VOOV's single largest holding at over 7% while also sitting in VOOG's top 5.

Apple is a company with a P/E ratio over 30 and a market cap pushing $3 trillion. To be fair, Apple does score well on some value metrics like earnings yield and sales-to-price per se. But this is why savvy Bogleheads have basically concluded that VOOV does a mediocre job of capturing the actual Value factor that the research references.

Now let's look at the historical performance of VOO, VOOG, and VOOV…

VOO vs VOOG vs VOOV – Historical Performance

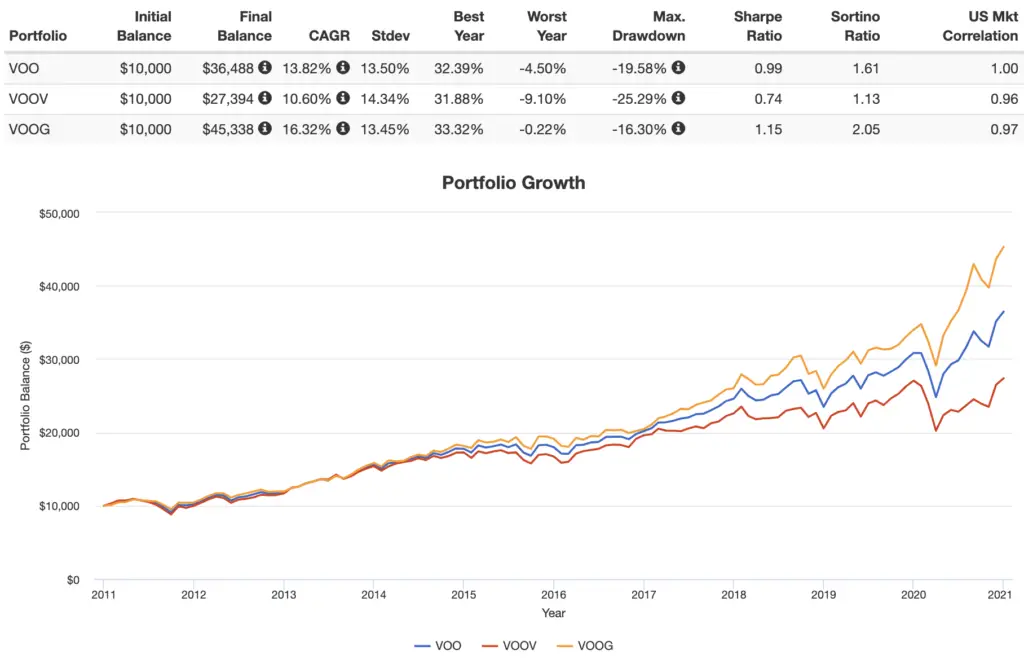
To summarize performance in a sentence, VOO, VOOG, and VOOV have returned an annualized 14.98%, 16.96%, and 12.12% respectively since their inception in 2010 and looking through April 2026, with respective volatilities of 17.06%, 18.87%, and 16.28%.

Using live fund data, here's VOO vs. VOOG vs. VOOV from their inception in 2010 through April 2026:

voo vs voog vs voov performance
Click to enlarge

I was hesitant even putting this backtest in here. Take it with a handful of salt. Don't succumb to recency bias by chasing performance and going all in on large cap growth stocks. Growth has had an amazing run over precisely the backtested time period. The next decade may – and likely will – look different.

Remember, Value has still outperformed Growth historically, and Value still has greater expected returns. The valuation spread between Value and Growth is huge currently. That is, Growth is looking extremely expensive relative to history, and Value is looking extremely cheap relative to Growth. Large spreads for Value have historically preceded its market outperformance. Only time will tell.

Next we'll look at the sector breakdown of VOO, VOOG, and VOOV to really illustrate the specific differences among what they're holding.

VOO vs VOOG vs VOOV – Sector Breakdown

Now let's look at the sector breakdown of VOO, VOOG, and VOOV. This section will really drive home what these funds are and aren't holding.

SectorVOOVOOGVOOV
Information Technology34.4%48.8%17.9%
Communication Services10.6%16.6%3.6%
Financials13.4%10.1%17.2%
Consumer Discretionary10.4%9.7%11.2%
Health Care9.6%6.8%12.8%
Industrials8.2%5.6%11.1%
Consumer Staples4.7%1.0%9.0%
Energy2.8%0.0%6.1%
Utilities2.2%0.5%4.3%
Materials1.8%0.3%3.5%
Real Estate1.8%0.5%3.3%

Source: Vanguard.

Notice how the market (VOO) at this point is over 34% tech, which makes VOOG over 48% tech!

Also notice how big Value sectors for VOOV include Financials, Healthcare, Industrials, Consumer Staples, for which the weights in VOO and VOOG are much lower.

Next we'll look at total assets and fees for these 3 funds…

VOO vs VOOG vs VOOV – AUM and Fees

VOO is one of the most popular ETFs ever created, with nearly $900 billion in assets as of the end of 2025 (and nearly $1.5 trillion when you include its mutual fund share classes). Its expense ratio is a very affordable 0.03%.

Honing in on Growth or Value in this case costs a bit more.

VOOV has about $6 billion in assets and a fee of 0.07%. Vanguard cut it down from 0.10% in 2025.

VOOG has about $22 billion in assets and also charges 0.07%.

For comparison and full disclosure, note that VUG (Vanguard Growth ETF) and VTV (Vanguard Value ETF), other popular Vanguard ETFs for Growth and Value respectively, both cost 0.04%, cheaper than both VOOG and VOOV, because they don't have to pay S&P licensing fees.

Conclusion

VOO, VOOG, and VOOV are all highly liquid funds from Vanguard.

Remember, VOOG + VOOV basically equals VOO. VOOG is Growth stocks from the S&P 500. VOOV is Value stocks from the S&P 500. While Growth has crushed Value for the recent decade 2010-2019, Value has still outperformed Growth historically, and Value has greater expected returns than Growth. Growth is currently looking extremely expensive relative to history (and fundamentals do not explain this expensiveness), and Value is looking extremely cheap relative to Growth. That said, all crystal balls are cloudy.

VOO is cheaper than VOOG and VOOV in terms of fees. But I wouldn't own VOOG or VOOV anyway, because VOOG does a comparatively poor job of capturing actual Growth stocks, and VOOV does a comparatively poor job of capturing actual Value stocks. If you care about the exposure you're paying for, here's my breakdown of value funds, and here are some recommendations for large cap growth.

Moreover, Vanguard has some other, cheaper funds for these same segments, namely VTV for Value and VUG for Growth. If you just want an inexpensive Vanguard fund to hone in on Value or Growth, go with one of those. They both only cost 0.04%. These are cheaper because they don't have to pay to use the S&P name.

Value and Growth tend to switch back and forth in terms of periods of one outperforming the other. Market timing usually doesn't work, and recency bias is all too real. If you don't care about tilting (overweighting) one of these styles, just buy VOO to capture the S&P 500 and call it a day.

These 3 ETFs are very different. Notice how VOOG has only 140 holdings and a tech sector weight of nearly 50%, for example, while VOOV has about 300 more holdings and a tech sector weight of “only” 18%.

VOO currently tilts heavily toward Growth because it's market-cap weighted, and the largest companies in the S&P 500 today are classified as Growth stocks. The top 10 holdings account for over 40% of the fund, and they're almost exclusively in the tech, communication, and consumer discretionary sectors. Despite being a large cap blend fund, VOO's tech sector weight is still a whopping 34%.

So if you already hold VOO and you're thinking about adding VOOG “for more growth exposure,” you may want to pause and recognize you've already got a lot. VOO is already over 1/3 large cap tech, so you'd just be concentrating risk further, which may result in undesirable outcomes. A salient example of this is 2022, when VOOG finished the year down 30% while VOOV was down only 5%.

Another elephant to briefly mention here is these broad retail ETFs like VOOG and VOOV provide very naive and pretty watered-down exposure to academic equity factors. Don't expect them to deliver near the magnitude of factor premium that the academic literature documents. I don't think anyone is doing that, but I figured I'd explicitly note it since my audience asks about factors a lot.

Conveniently, all these funds should be available at any major broker, including M1 Finance, which is the one I'm usually suggesting around here.

Canadians can find the above ETFs on Questrade or Interactive Brokers. Investors outside North America can use Interactive Brokers.

Do you own VOO, VOOG, or VOOV? Let me know in the comments.


Disclosure: I am long VOO in my own portfolio.

Disclaimer:  While I love diving into investing-related data and playing around with backtests, this is not financial advice, investing advice, or tax advice. The information on this website is for informational, educational, and entertainment purposes only. Investment products discussed (ETFs, mutual funds, etc.) are for illustrative purposes only. It is not a research report. It is not a recommendation to buy, sell, or otherwise transact in any of the products mentioned. I always attempt to ensure the accuracy of information presented but that accuracy cannot be guaranteed. Do your own due diligence. I mention M1 Finance a lot around here. M1 does not provide investment advice, and this is not an offer or solicitation of an offer, or advice to buy or sell any security, and you are encouraged to consult your personal investment, legal, and tax advisors. Hypothetical examples used, such as historical backtests, do not reflect any specific investments, are for illustrative purposes only, and should not be considered an offer to buy or sell any products. All investing involves risk, including the risk of losing the money you invest. Past performance does not guarantee future results. Opinions are my own and do not represent those of other parties mentioned. Read my lengthier disclaimer here.

m1

Are you nearing or in retirement? Use my link here to get a free holistic financial plan and to take advantage of 25% exclusive savings on financial planning and wealth management services from fiduciary advisors at Retirable to manage your savings, spend smarter, and navigate key decisions.

retirement peace of mind

Related Posts

  • SPD ETF Review – Simplify US Equity PLUS Downside Convexity ETF
  • The 6 Best AI ETFs To Bet on Artificial Intelligence in 2026
  • Roth IRA vs. Traditional IRA – Which Is Better for You? (2026)
  • VT ETF Review – Is VT a Good Investment? (Vanguard Global Stock Market)
  • VUG vs. VOOG – Which Vanguard ETF for Large Growth Stocks?

About John Williamson, APMA®

Analytical data nerd, investing enthusiast, fintech consultant, Boglehead, and Oxford comma advocate. I'm not a big fan of social media, but you can find me on Reddit.

Reader Interactions

Comments

  1. Musky says

    September 30, 2022 at 11:30 am

    I would think putting 50% in VOOV and 50% in VOOG would then capture all of VOO and allowing you to double up on the few growth stocks that also qualify as value and the few value stocks that also qualify as growth. but you 10 year back test did not show an advantage. Must of been gobbled up in additional fees?

    Reply
    • John Williamson says

      October 2, 2022 at 8:20 pm

      Probably no real advantage and potentially more concentration risk within a handful of companies.

      Reply
  2. Gerard says

    April 26, 2022 at 9:09 am

    While very much appreciating all of the input and info, I was wondering where VYM would stand next to the 3 ? ( voo, voog, voov)?

    Reply
    • John Williamson says

      April 26, 2022 at 10:00 am

      VYM would be most similar to VOOV but more focused on dividend yield whereas VOOV seeks to identify Value stocks.

      Reply
  3. Megan says

    April 6, 2022 at 2:24 pm

    Why is the cost of VOO so much more than SPLG? Why would someone purchase VOO over SPLG when the track the same index?

    Thanks,

    Reply
    • John Williamson says

      April 7, 2022 at 1:49 pm

      They cost the same at 0.03%.

      Reply
      • Megan says

        April 7, 2022 at 2:37 pm

        Sorry, what I meant was why is the share price so different? Is it the total AUM?

        VOO $400 ish/share
        SPLG $50 ish/share

        I noticed that their returns over the years have been similar. So why would one spend $400/share vs. $50/share?

        I hope that makes sense. Thank you!

        Reply
        • John Williamson says

          April 8, 2022 at 4:56 pm

          Ah. SPLG probably had some splits. If your broker offers fractional shares, share price doesn’t matter.

          Reply
          • Megan says

            April 28, 2022 at 9:01 am

            Oh, okay. That makes sense. Unfortunately, mine does not right now. Thanks for the response!

Leave a Reply Cancel reply

Your email address will not be published. Required fields are marked *

Primary Sidebar

  • Facebook
  • Instagram
  • Reddit
  • Twitter
  • YouTube
  • Patreon

Join 5,372 other investors

Take control of your financial future by subscribing to receive exclusive emails with expert tips, news, and notifications of new posts and important updates.

Don't worry, I hate spam too. No ads.

John Williamson, APMA®

Analytical data nerd, investing enthusiast, fintech consultant, Boglehead, and Oxford comma advocate. I'm not a big fan of social media, but you can find me on Reddit. Read More…

Most Popular

Ray Dalio All Weather Portfolio Review, ETFs, & Leverage (2026)

HEDGEFUNDIE’s Excellent Adventure (UPRO/TMF) – A Summary

Golden Butterfly Portfolio Review, Performance, & ETFs (2026)

David Swensen Portfolio (Yale Model) Review and ETFs To Use

55 Lazy Portfolios and Their ETF Pies for M1 Finance (2026)

VIG vs. VYM – Vanguard’s 2 Popular Dividend ETFs (Review)

Warren Buffett ETF Portfolio (90/10 Rule) Review & ETFs

Bogleheads 3 Fund Portfolio Review and Vanguard ETFs (2026)

Paul Merriman Ultimate Buy and Hold Portfolio Review & ETFs (2026)

The Best M1 Finance Dividend Pie for FIRE & Income Investors

m1 sidebar

retirable

Portfolio Asset Allocation by Age – Beginners To Retirees

The 7 Best Small Cap ETFs (3 From Vanguard) for 2026

9 Best International ETFs To Buy (6 From Vanguard) in 2026

The 3 Best Inverse ETFs to Short the S&P 500 Index in 2026

Ben Felix Model Portfolio (Rational Reminder, PWL) ETFs & Review

Factor Investing and Factor ETFs – The Ultimate Guide

NTSX ETF Review – WisdomTree U.S. Efficient Core ETF (90/60)

The Ginger Ale Portfolio (My Own Portfolio) and M1 ETF Pie

TQQQ – Is It A Good Investment for a Long Term Hold Strategy?

QYLD Review – Is This ETF a Good Long Term Investment?

The 12 Best T Bill ETFs (Treasury Bills) To Park Cash in 2026

JEPI ETF Review – JPMorgan Equity Premium Income ETF

SPAXX vs. FZFXX, FDIC, FCASH, FDRXX – Fidelity Core Position

Recent Posts

HAPI ETF – Should You Invest in the Best Places to Work?

Yield on Cost – The Useless Metric Dividend Investors Love

NTSD ETF Review – WisdomTree Efficient U.S. Plus International Equity Fund

JEPQ ETF Review – JPMorgan Nasdaq Equity Premium Income ETF

Dimensional Launches DFMC ETF – US Micro Cap Portfolio ETF Class

ALLW ETF Review – SPDR Bridgewater All Weather ETF

VBIL vs. SGOV – Vanguard or iShares ETF for T-Bills?

VBIL and VGUS – Vanguard Launches 2 New ETFs for T-Bills

RSBY ETF Review – Return Stacked® U.S. Bonds & Futures Yield ETF

1 ETF for Life to Get Rich? It’s Not One You’d Guess…

How to Get 35% off a New Tesla Model Y (1.99% APR Financing Promo)

SPYM ETF Review – A Cheaper Way To Buy the S&P 500 Index?

M1 Finance New Dividend Reinvestment Features Are Here! (Sneak Peek)

RSSY ETF Review – Return Stacked® U.S. Stocks & Futures Yield ETF

RSBT ETF Review – Return Stacked® Bonds & Managed Futures ETF

View All...

Footer

  • Facebook
  • Instagram
  • Reddit
  • Twitter
  • YouTube
  • Patreon

Amazon Affiliate Disclosure

OptimizedPortfolio.com is a participant in the Amazon Services LLC Associates Program, an affiliate advertising program designed to provide a means for sites to earn advertising fees by advertising and linking to Amazon.com.

Email Newsletter

Sign up to receive email updates when a new post is published.

Don't worry, I hate spam too. No ads.

About - My Toolbox - Privacy - Terms - Contact


Copyright © 2026 OptimizedPortfolio.com