I designed the Vigorous Value Portfolio for those wanting to heavily tilt Size and Value. Below are the details on its components and fund selection.
Interested in more Lazy Portfolios? See the full list here.
Disclosure: Some of the links on this page are referral links. At no additional cost to you, if you choose to make a purchase or sign up for a service after clicking through those links, I may receive a small commission. This allows me to continue producing high-quality content on this site and pays for the occasional cup of coffee. I have first-hand experience with every product or service I recommend, and I recommend them because I genuinely believe they are useful, not because of the commission I may get. Read more here.
Contents
What Is the Vigorous Value Portfolio?
Based on the current research on asset pricing, most seasoned investors think it's sensible to overweight, or tilt, Emerging Markets stocks, Value stocks (stocks thought to be underpriced relative to their book value), and small stocks relative to their market weights. I designed this aggressive 100% stocks portfolio to do that globally to an extent greater than what is typically seen, while maintaining diversification across cap sizes and geographies. I dubbed it the Vigorous Value Portfolio because it does indeed tilt Value quite vigorously, and because we would expect it to be more volatile than something like 100% VT or the S&P 500.
This portfolio is not unlike Paul Merriman's 4 Fund Portfolio, but this one more meticulously avoids small cap growth stocks and goes beyond U.S. borders. I'll explain these details below.
The Vigorous Value Portfolio looks like this:
15% U.S. Large Cap Stocks
15% U.S. Large Cap Value
30% U.S. Small Cap Value
5% Emerging Markets
5% Emerging Markets Large Cap Value
10% Emerging Markets Small Cap Value
5% Developed Markets (ex-US)
5% Developed Markets (ex-US) Large Cap Value
10% Developed Markets (ex-US) Small Cap Value
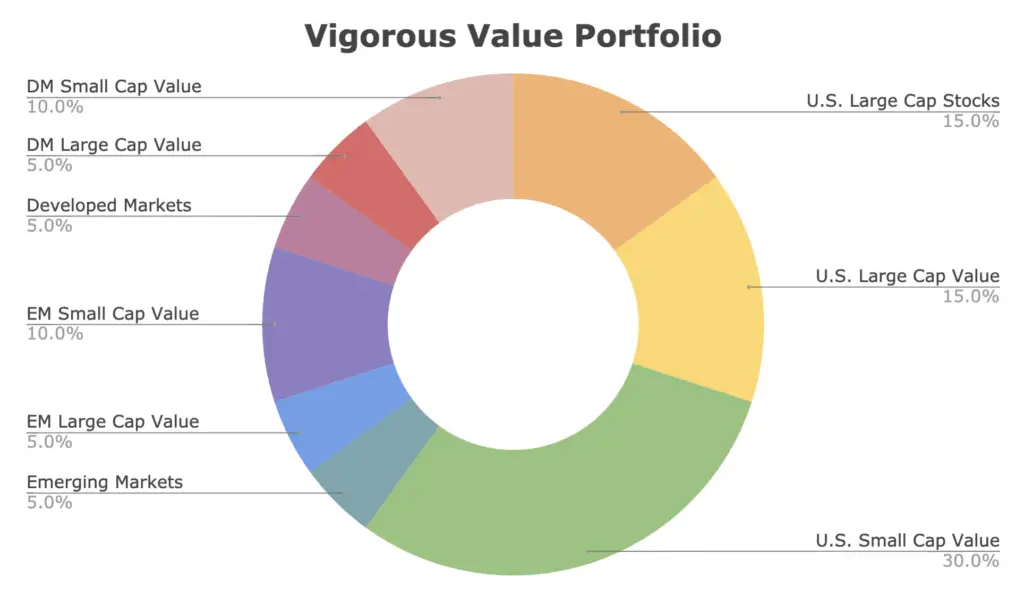
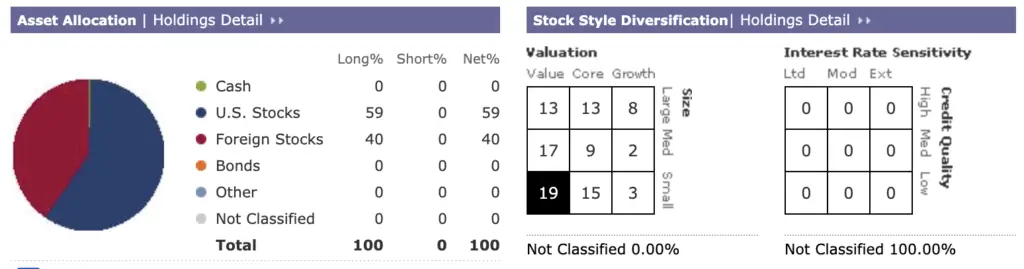
This portfolio uses a 60/40 ratio of U.S. to international stocks, 2:1 Value to Growth, roughly 1:1 large caps to small caps, and 1:1 Developed Markets to Emerging Markets. Here's that visualized in the Morningstar X-Ray:
Below I'll explain the reasoning behind each asset and subsequent fund selection in detail. Fund selection was based primarily on factor loading and secondarily on liquidity and fees. They're basically the same funds I laid out in my post on the best Value ETFs across cap sizes and geographies.
U.S. Large Cap Stocks – 15%
The U.S. stock market comprises roughly half of the global stock market. The Value and Size premia have experienced periods of underperformance historically, so part of keeping some large cap growth exposure comes from U.S. large caps, in this case the famous S&P 500 Index – considered a sufficient barometer for “the market” – via Vanguard's VOO. This segment captures household names like Amazon, Apple, Google, Johnson & Johnson, Microsoft, etc.
Why not use VTI to capture the entire U.S. stock market including some small- and mid-caps? I'll answer that later.
U.S. Large Cap Value – 15%
Though the Value premium has suffered for the decade 2010-2020. there's no legitimate reason to think that it has disappeared. That is, on average, we would still expect Value stocks to outperform Growth stocks over the long term. Interestingly, there have been more 10 year periods where the market delivered a negative premium than 10 year periods where Value delivered a negative premium.
I don’t employ or advise market timing, but AQR maintains that Value is basically the cheapest it’s ever been right now relative to history with the largest valuation spread between Value and Growth, suggesting that now may actually be the worst time to give up on the factor, and that it’s due for a comeback. Value stocks beat Growth stocks in 2021 and 2022, so that comeback may indeed be happening.
For this component I'm suggesting RPV, the Invesco S&P 500 Pure Value ETF. As the name suggests, this fund seeks to track the S&P 500 Pure Value Index. RPV is the best fund I've found for exposure to the Value factor in U.S. large caps; it has much greater exposure than competitors like VLUE, VTV, and IUSV. Conveniently, the fund also delivers positive loading to the Profitability factor.
U.S. Small Cap Value – 30%
I didn't use VTI (total U.S. stock market) here because I want to avoid those pesky small-cap growth stocks which don't tend to pay a risk premium, and because we're getting plenty of purposeful small cap exposure. Even mid-cap growth hasn't beaten large cap blend historically on a risk-adjusted basis. We do get some mid cap exposure from the international indexes, but this portfolio takes a barbell approach for the U.S. stocks, only getting growth exposure in large caps.
Specifically, small cap growth stocks are the worst-performing segment of the market and are considered a “black hole” in investing. The Size factor premium – small stocks beat large stocks – seems to only apply in small cap value. As Cliff Asness from AQR says, “Size matters, if you control your junk.” Basically, if you want to bet on small caps, the evidence suggests to do so in small cap value, preferably while also screening for profitability.
By “risk premium,” I'm referring to the independent sources of risk identified by Fama and French (and others) that we colloquially call “factors.” Examples include Beta, Size, Value, Profitability, Investment, and Momentum. I delved into those details in a separate post that I won't repeat here, but I'll be referring to these factors and their benefits quite a few times below. Though it may sound like magic, the evidence suggests that overweighting these independent risk factors both increases expected returns over the long term and decreases portfolio risk by diversifying the specific sources of that risk, as the factors are lowly correlated to each other and thus show up at different times.
The fund I've chosen for U.S. small value is AVUV from Avantis. Previously, the S&P Small Cap 600 Value index (VIOV, SLYV, IJS) was sort of the gold standard for the U.S. small cap value segment. AVUV, the new kid on the block, has provided some extremely impressive exposure – superior to that of those funds – in its relatively short lifespan thus far. I went into detail about this in a separate “small value showdown” post here. In a nutshell, it has been able to capture smaller, cheaper stocks than its competitors, with convenient exposure to the Profitability factor, all while considering Momentum in its trades.
Small cap stocks only make up about 6% of the market at their market weight, of which small cap value is about half that. Here we're giving small caps room to shine by weighting them equal to large caps.
Emerging Markets – 5%
Emerging Markets refer to developing countries – China, Hong Kong, Taiwan, India, Brazil, Thailand, etc.
Stocks in these countries have paid a significant risk premium historically, compensating investors for taking on their greater risk. Arguably more importantly, Emerging Markets offer a lower correlation to U.S. stocks compared to Developed Markets, and thus are a superior diversifier.
At its global weight, the U.S. only comprises about half of the global stock market. Most U.S. investors severely overweight U.S. stocks (called home country bias) and have an irrational fear of international stocks.
No single country consistently outperforms all the others in the world. If one did, that outperformance would also lead to relative overvaluation and a subsequent reversal. Consequently, we want to diversify across geographies in stocks.
During the period 1970 to 2008, an equity portfolio of 80% U.S. stocks and 20% international stocks had higher general and risk-adjusted returns than a 100% U.S. stock portfolio. Specifically, international stocks outperformed the U.S. in the years 1986-1988, 1993, 1999, 2002-2007, 2012, and 2017.
In short, geographic diversification in equities has huge potential upside and little downside for investors.
Emerging Markets only comprise about 11% of the global stock market. This is why I don't use the popular VXUS (Vanguard's total international stock market fund) – because its ratio of Developed Markets to Emerging Markets is about 3:1. Here we're using a 1:1 ratio of Developed to Emerging Markets. I delved into this in a little more detail here.
Vanguard's Emerging Markets ETF is VWO.
Emerging Markets Large Cap Value – 5%
Just like in the U.S., we also want to specifically overweight large cap value stocks in Emerging Markets, as the Size and Value premia show up at different times across geographies.
The fund I've chosen for this segment is FNDE from Schwab. Its name is pretty long: Schwab Fundamental Emerging Markets Large Company Index ETF. Its “fundamental” in the name refers to its use of RAFI fundamental factors such as revenue, cash flow, etc. to weed out companies with weak profitability.
Emerging Markets Small Cap Value – 10%
There's currently no ideal fund for this very narrow segment of the global market. In June 2021, Avantis actually filed for an all-cap value fund for Emerging Markets (AVES launched in September, 2021) that'll likely have positive loading on the Size factor. We’ll see what kind of exposure it's able to deliver in the future.
For now, we're using a small cap dividend fund from WisdomTree as a proxy for Value within small caps in Emerging Markets. Don't let this sound discouraging. The fund also screens for strong financials and has appreciable loading across Size, Value, and Profitability. The fund is DGS, the WisdomTree Emerging Markets SmallCap Dividend Fund.
Developed Markets – 5%
Developed Markets refer to developed countries outside the U.S. – Australia, Canada, Germany, the UK, France, Japan, etc.
While Emerging Markets are the better diversifier for U.S. stocks, there's no reason to completely avoid Developed Markets, as there have been years where they outperformed the rest of the world (including the U.S.).
Vanguard offers a low-cost fund called the Vanguard FTSE Developed Markets ETF. Its ticker is VEA.
Developed Markets Large Cap Value – 5%
As we did in the U.S., we can overweight large cap value in Developed Markets with EFV, the iShares MSCI EAFE Value ETF.
Developed Markets Small Cap Value – 10%
Lastly, we also want to overweight small cap value stocks in Developed Markets.
Avantis recently launched a fund available to retail investors that specifically targets international small cap value in Developed Markets – AVDV.
I know I'm being a bit hypocritical in suggesting the actively-managed AVDV here while refusing to include the actively-managed AVUV for U.S. small value above. I think this case is different because there are far fewer options for ex-US small value. Prior to the launch of AVDV, we were forced to use another dividend fund from WisdomTree (DLS) as a proxy for small cap value in Developed Markets.
AVDV is currently the only fund available to the public that specifically targets Size and Value (and conveniently, Profitability) in ex-US stocks. As a bonus, AVDV is also roughly half the cost of the former option DLS.
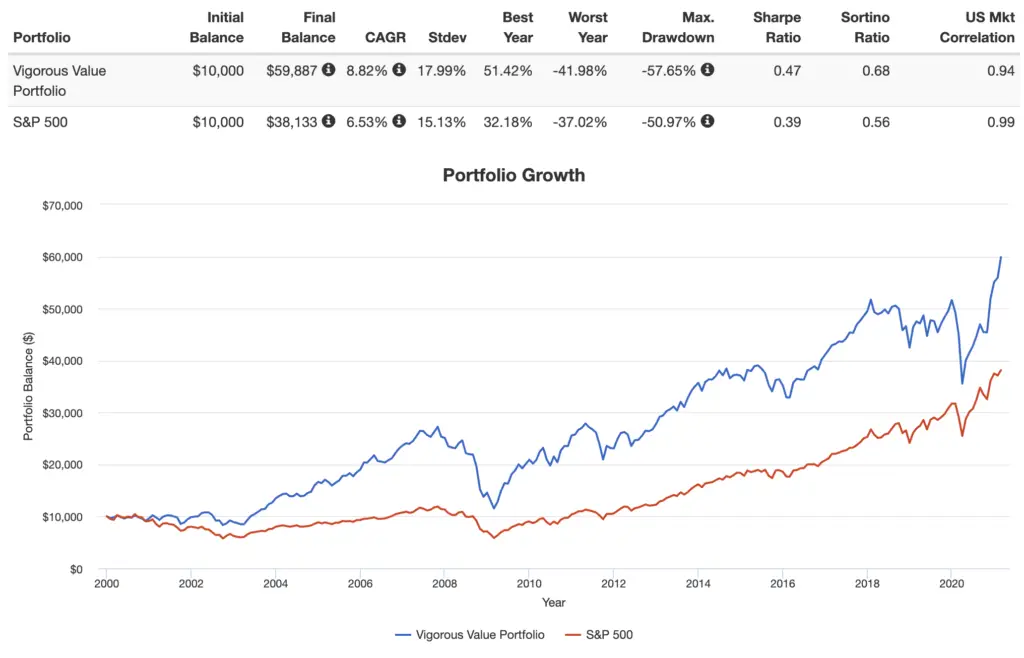
Vigorous Value Portfolio – Historical Performance
Some of these funds are pretty new, so I had to use comparable mutual funds in some cases to extend this backtest. The furthest I could get was 2000, going through February 2021:
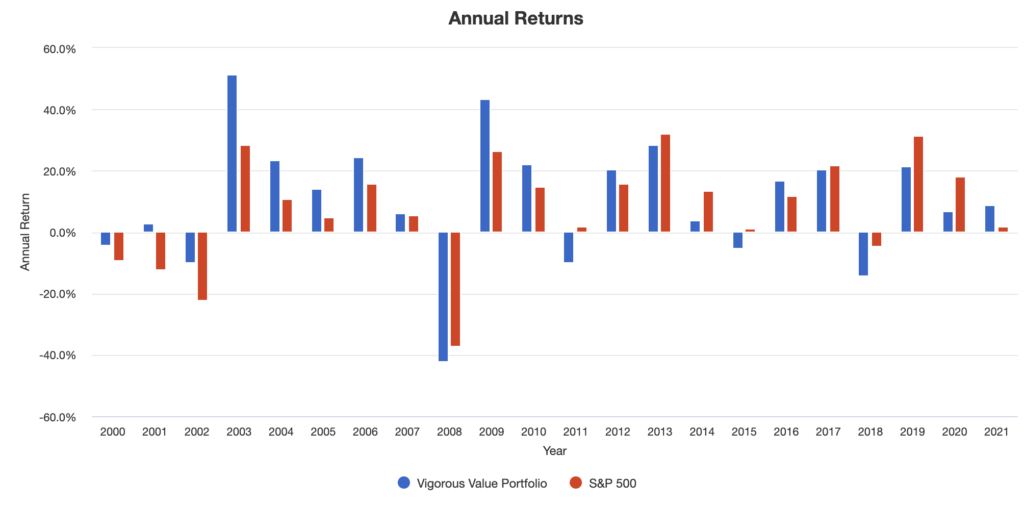
Here are the annual returns:
Here are the rolling returns:
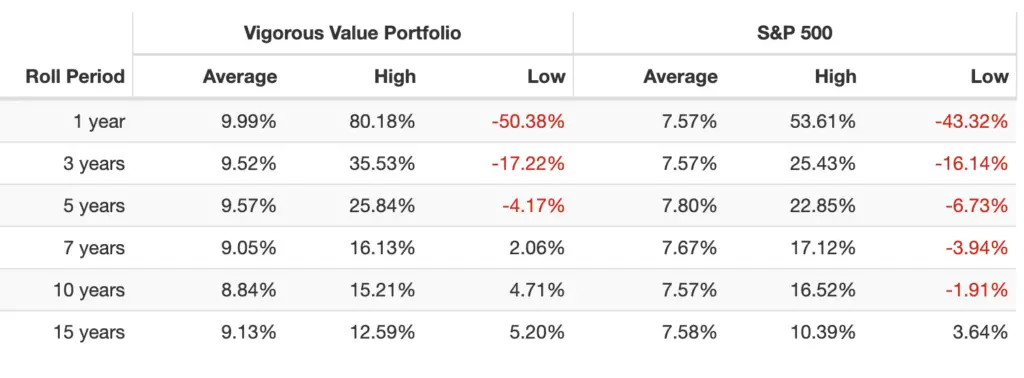
Keep in mind the Size and Value premia and international stocks suffered for the decade 2010-2020, otherwise I think the differences in performance metrics would have been even greater.
Vigorous Value Portfolio Pie for M1 Finance
So putting all the funds together, the resulting Vigorous Value Portfolio looks like this:
- VOO – 15%
- RPV – 15%
- AVUV – 30%
- VWO – 5%
- FNDE – 5%
- DGS – 10%
- VEA – 5%
- EFV – 5%
- AVDV – 10%
You can add this pie to your portfolio on M1 Finance by clicking this link and then clicking “Save to my account.”
Canadians can find the above ETFs on Questrade or Interactive Brokers. Investors outside North America can use Interactive Brokers.
Questions, comments, concerns, criticisms? Let me know in the comments.
Disclosure: I am long VOO, AVUV, VEA, DGS, VWO, and AVDV in my own portfolio.
Interested in more Lazy Portfolios? See the full list here.
Disclaimer: While I love diving into investing-related data and playing around with backtests, this is not financial advice, investing advice, or tax advice. The information on this website is for informational, educational, and entertainment purposes only. Investment products discussed (ETFs, mutual funds, etc.) are for illustrative purposes only. It is not a research report. It is not a recommendation to buy, sell, or otherwise transact in any of the products mentioned. I always attempt to ensure the accuracy of information presented but that accuracy cannot be guaranteed. Do your own due diligence. I mention M1 Finance a lot around here. M1 does not provide investment advice, and this is not an offer or solicitation of an offer, or advice to buy or sell any security, and you are encouraged to consult your personal investment, legal, and tax advisors. Hypothetical examples used, such as historical backtests, do not reflect any specific investments, are for illustrative purposes only, and should not be considered an offer to buy or sell any products. All investing involves risk, including the risk of losing the money you invest. Past performance does not guarantee future results. Opinions are my own and do not represent those of other parties mentioned. Read my lengthier disclaimer here.

Are you nearing or in retirement? Use my link here to get a free holistic financial plan and to take advantage of 25% exclusive savings on financial planning and wealth management services from fiduciary advisors at Retirable to manage your savings, spend smarter, and navigate key decisions.

How about a reverse of this, with LCB being the core instead of SCV? Something like
30% VOO
15% RPV
15% AVUV
And so on.
“This portfolio is not unlike Paul Merriman’s 4 Fund Portfolio, but this one more meticulously avoids small cap growth stocks and goes beyond U.S. borders.”
Not only that, it looks to me like something of a halfway stop between the aggressive/100% equity version of the UB&H and the 4 Fund Portfolio. More complex than the latter, very similar to the former, but removing the Small Cap Blend funds and REITs and substituting in EM Large and Small Value. Definitely interesting for that aspect alone.
I’d be fascinated to see how this would perform with (some or all of) NTSX, NTSI, and NTSE in place of the standard all-cap blend funds, but that seems like a bit of a nightmare to backtest.
Love your site. Would be great if you posted links to Portfolio Visualizer in addition to your screenshots! Want to play around adding some 2.5x ITT bonds (TYA) to this portfolio
First off, thanks. I like this site a lot. I have added a avuv thanks to it.
One thing I see in the linked example is the numbers may get biased doing single lump sums at the start of decades that happen to be strong for one sector vs another. I did not start off with a trust fund – I started off with school loans. So a lump some at the start with no contributions is the exact opposite of what I was able to do and I think a lot of other people starting off saving for retirement. What ends up happening if I take your linked example, switch to 750 initial and monthly contribution, and keep the starting year the same and go up to today is that the tables turn and this portfolio does not do as well as a simple S&P index.
I realize that if you happen to hit the lotto or have a trust fund, it is better to invest it all day 1 and not dca as time in market beats timing the market. Realistically most people I know don’t start out that way. The lump sum starting in 2000 does not seem fair though as that was a better decade for large cap value vs growth (not just compared to the decade after where growth just kills it but also the decade before – 1990-2000 large cap growth.
I’m not against the value segment. I just think I sometimes see it overemphasized based off the starting year when doing lump sum initial amounts and 0 regular contributions.
I am curious if there is a place to see historical data on us sectors prior to 1972?
Thanks.
Thanks, Nate. Here’s a century. We care about rolling returns, as Value and Growth tend to trade off. Value may outperform over the next decade. Only time will tell. Investors susceptible to tracking error regret should probably just hold a broad market index fund.
Cool, thanks for that link and info.
While this seems great for a young investor who won’t need to withdraw anytime soon, it’s pretty complicated and volatile for many of us.
I prefer limiting my holdings to about 4 funds:. AVUS, AVDE, AVEM, BNDW. While it won’t provide as much value slant, it’s much simpler and less volatile, but with market beating expected returns.
Also, shouldn’t you compare this to the total world market, like VT?
Factor diversification tends to reduce volatility and risk, as I explained here.
But there’s also too much of a good thing. Being so heavily slanted towards small cap value reduces risk adjusted returns, though of course might still improve overall returns. For instance, I’ve read DFA research showing holding about 15% small-cap value seems to provide the best risk-adjusted returns, though again not necessarily overall returns.
AVUS, AVDE, and AVEM seem to apply moderate factor slants across all market capitalizations. While this degree of slant might might produce the best overall returns, it seems likely to result in a nice balance of volatile and returns.
Historical risk-adjusted return should not be the primary concern in portfolio construction. Nor should volatility per se. Factors are long-short portfolios. Long-only tilts are still small even if the allocation is “heavily slanted.” It requires a large allocation to get away from concentration in market beta. Swedroe understands this and goes 100% SCV for this reason. AVUS, AVDE, and AVEM provide very tiny, almost negligible tilts that don’t even seem worth the extra cost. It is not at all “a nice balance.”
Again, size (SMB) is only one consideration, and market cap for AVUS, AVDE, and AVEM is about half that of Vanguard. As I understand, the other 4 factors (HML, RMW, CMA, Momentum) can be applied to all capitalizations.
While they’re still new like all Avantis Funds, they’ve outperformed their benchmarks so far. Their returns seem pretty comparable combining small-cap value funds with standard index funds, but with fewer funds/less complexity.
AVEM’s factor loading, for example, does not look materially different from VWO.
Using risk adjusted return probably doesn’t make sense for someone young but as I approach retirement there’s not way I can live with the volatility and max downturn numbers in most of your portfolios.
When I plug allocations into Portfolio Visualizer, I start with VTI at 55% and SCHR at 42% with a little in cash. Any adjustment outside VTI like adding VEU or VBR really bumps up max downturn risk and reduces overall return.
Greg, any portfolio should obviously be adjusted for time horizon and risk tolerance. All else equal, this means increasing the allocation to bonds as time passes. A backtest going back 10 years doesn’t mean much. As I’ve noted many times, Size and Value both suffered greatly over precisely that time period.
After reading so much on this site and being more intrigued than ever by LETS, I’m wondering about leveraged value ETFs. Any of those out there?
I came across RWVG in a quick internet search and I realize it’s not a pure “value” ETF but I wondered if the 150/50 makes it work like leverage. Thanks
Hadn’t heard of RWVG but it’s not truly “leveraged” like I’ve discussed on this site; it’s just a long/short portfolio like a true factor definition.
IWDL is 2x Value, albeit very new and ETN structure so I wouldn’t use it anyway.
Seriously?
CAGR: Lower by 45%.
Ok that’s the price of reduced volatility, right?
Volatility: Higher by 20%. Oops.
But those drawdowns from the US domestic market will kill you. Sure.
Max Drawdown: 62% deeper.
And on it goes.
Across the board this portfolio is just about the worst one in the extensive list of portfolios I took it from.
People actually pay attention to you?
What? Where’d you get those numbers from?
why EFV for international value? What do you think about IVAL and IVLU?
Superior factor loading and liquidity. IVLU is comparable. IVAL looks worse across the board and costs much more.
Great work on this one. Curious, what exact funds/ETFs did you use for the back test? I am trying to replicate it to compare it to a portfolio that I am working on right now but I know you had to use similar funds/etfs since a few of your choices are newer etfs. Thanks! Jeff
Thanks, Jeff! Here are those funds I used. Definitely not identical swaps for some of them, but gives us a decent rough idea.
Thanks so much! Great job.
Thanks, Jeff!