Here's how to start with asset class and geographical diversification and then overlay factor diversification. I've called it the Factor Tank Portfolio.
Interested in more Lazy Portfolios? See the full list here.
Disclosure: Some of the links on this page are referral links. At no additional cost to you, if you choose to make a purchase or sign up for a service after clicking through those links, I may receive a small commission. This allows me to continue producing high-quality content on this site and pays for the occasional cup of coffee. I have first-hand experience with every product or service I recommend, and I recommend them because I genuinely believe they are useful, not because of the commission I may get. Read more here.
Contents
Introduction – Volatility, Risk, Drawdowns, and Diversification
Before diving into the components of this portfolio, I have to talk about its purpose and the ideas behind its approach.
Volatility is the variability of return of a portfolio. It’s a measure of the degree of its up-and-down movement, denoted by standard deviation as a percentage. Lower volatility means a smoother ride. More volatility means more of a roller coaster of peaks and valleys. We can define “risk” in this context as permanent loss of capital. A more volatile portfolio naturally has more risk because when it drops (called a drawdown), it may take a long time to recover from a valley, or it may never recover. But the word “risk” can also describe the risk of not meeting one's financial objective (not saving enough or not generating a high enough investment return) and the risk of a wide dispersion of possible outcomes for the portfolio (think uncertainty, sequence risk, etc. that makes accurate financial planning harder).
A good portfolio is constructed to address these types of risks and the personal risk tolerance and time horizon of the investor. Many investors try to mitigate their portfolio’s volatility and risk. Many of those who don’t probably should, as investors tend to overestimate their tolerance for risk, only realizing it during a market crash when they panic. Greater volatility and risk require a stronger stomach. The mitigation thereof is done through diversification – spreading the portfolio out across different asset types, areas around the world, and independent risk factors. I went into detail about how diversification works in a separate post here.
Basically, first we want to find uncorrelated assets that tend to move in different directions at different times. This is widely accepted and is fairly easy to understand for the average investor. A lower correlation coefficient between two assets means a better diversification benefit. These correlations aren’t static and can shift over time, but historically and currently, the 3 best diversifiers with the lowest correlations among them are stocks, long treasury bonds, and gold.
We could stop there and have a very well-diversified portfolio, just like the All Weather Portfolio or my Neapolitan Portfolio. But there's more…
What's perhaps less popular and harder to grasp is another type of diversification. Our best understanding of asset pricing points to different independent sources of portfolio risk, colloquially called “factors,” that show up at different times and tend to pay a premium. I delved into these in a separate post here. In a nutshell, we also want to diversify across these risk factors to decrease portfolio risk, as the correlation between them is virtually zero. We also conveniently get greater expected returns in doing so.
Antti Ilmanen and Jared Kizer concluded: “The argument that we make for factor diversification partly rests on the expectation that the positive factor premia will continue to persist. But the correlations (or relative lack thereof) of these premia with each other are at least as important. … Factor diversification is highly effective because the average correlation between the five constituents is virtually zero. … It is hard not to conclude that smart investors should include cost-effectively sourced dynamic factor premia into long-term portfolio allocations.”
Louis Scott and Stefano Cavaglia concluded: “Our result which favors a portfolio of factor premia overlay remains unchanged. As previously suggested, the benefit of factor premia is not in their mean returns, but rather in their ability to mitigate adverse conditions…”
I think this beautiful fact is often overlooked or forgotten by factor investors. Most are factor tilting for the expected premiums, and rightfully so! That's fine. But don't forget about the diversification benefit of getting away from concentration in market beta (market risk).
The Factor Tank Portfolio
I couldn't really think of a clever name for this portfolio so I just called it the Factor Tank Portfolio, for a couple reasons. First, it utilizes both types of diversification I described above (plus the obvious geographical diversification in stocks) to the point where the portfolio should be pretty impervious to any environment, just like a tank. In another sense, the word “tank” could be thought of like a fish tank in which we're tossing all the different risk factors and asset types for maximum diversification.
I'd classify this portfolio as somewhat “advanced.” Novice investors may not know what the heck they're looking at here. I'd encourage you to do your due diligence and always understand what you're buying. If you're uncertain about your investing strategy, you're potentially opening yourself up to things like cognitive dissonance and tracking error regret. Again, two of my own resources that provide the foundational theory for this portfolio are this post on diversification and this post on factors. But you don't have to take my word for it! You can go do your own research, too; you may find some differing opinions.
In selecting specific funds, I looked for sufficient liquidity, appreciable factor loading (where the expected premium would outweigh the fee), low tracking error, and low fees.
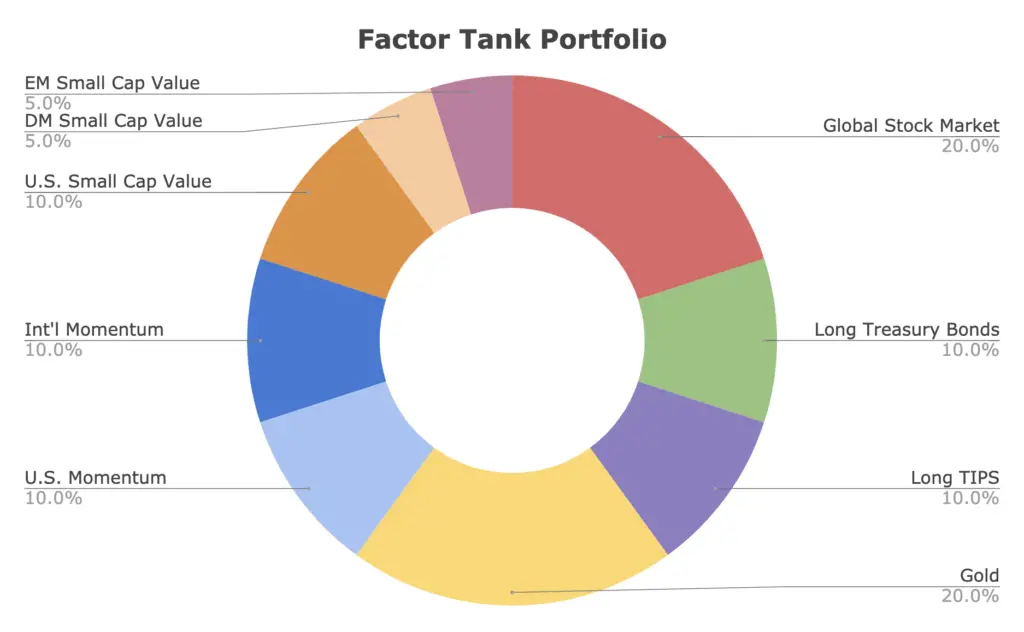
We can even think of this portfolio like a more advanced, more nuanced version of the famous All Weather Portfolio, albeit with less bonds (and ditching the awful commodities). I greatly value simplicity, but given the current funds available and the exposure I'm targeting, there's really no getting around slicing this thing up pretty thinly. The Factor Tank Portfolio is 60/20/20 stocks/bonds/gold and looks like this:
- 20% Global Stock Market
- 10% U.S. Small Cap Value
- 5% Developed Markets (ex-US) Small Cap Value
- 5% Emerging Markets Small Cap Value
- 10% U.S. Momentum
- 10% International Momentum
- 10% Long U.S. Treasury Bonds (STRIPS)
- 10% Long TIPS
- 20% Gold
Below I'll explain the reasoning behind each asset in detail.
Global Stock Market – 20%
Hopefully international diversification in stocks seems intuitive and requires no explanation. I'm tired of seeing lazy portfolios using only U.S. stocks and hearing people say you “only need to invest in the U.S.” Get outta here.
At its global weight, the U.S. only comprises about half of the global stock market. Most U.S. investors severely overweight U.S. stocks (called home country bias) and have an irrational fear of international stocks.
No single country consistently outperforms all the others in the world. If one did, that outperformance would also lead to relative overvaluation and a subsequent reversal. Consequently, we want to diversify across geographies in stocks.
During the period 1970 to 2008, an equity portfolio of 80% U.S. stocks and 20% international stocks had higher general and risk-adjusted returns than a 100% U.S. stock portfolio. Specifically, international stocks outperformed the U.S. in the years 1986-1988, 1993, 1999, 2002-2007, 2012, and 2017.
Dalio and Bridgewater maintain that global diversification in equities is going to become increasingly important given the geopolitical climate, trade and capital dynamics, and differences in monetary policy. They suggest that it is now even less prudent to assume a preconceived bet that any single country will be the clear winner in terms of stock market returns.
In short, geographic diversification in equities has huge potential upside and little downside for investors.
Vanguard offers a low-cost, market cap weighted fund for the total world stock market, which is VT. This keeps things extremely simple for this piece and provides immediate global diversification in stocks.
U.S. Small Cap Value – 10%
Here's where the factor tilting (overweighting) starts. A single fund here provides exposure to the Size, Value, and Profitability factors. There's no global small cap value fund, so we have to use several to cover the U.S., other Developed Markets, and Emerging Markets.
Previously, the S&P Small Cap 600 Value index (VIOV, SLYV, IJS) was basically the gold standard for the U.S. small cap value segment. AVUV, the new kid on the block from Avantis, has provided some extremely impressive exposure – superior to that of those funds – in its relatively short lifespan thus far, so much so that it recently replaced VIOV in my own portfolio. I went into detail about this in a separate “small value showdown” post here. In a nutshell, it has been able to capture smaller, cheaper stocks than its competitors, with convenient exposure to the Profitability factor, all while considering Momentum in its trades, and we would expect the premium to more than make up for its slightly higher fee.
Developed Markets (ex-US) Small Cap Value – 5%
Until just about a year ago, an expensive dividend fund from WisdomTree (DLS) was arguably the best way to access this segment of the global market. Now, Avantis has launched a fund available to retail investors that specifically targets international small cap value – AVDV. It is the only fund available to the public that specifically targets Size and Value (and conveniently, Profitability) in ex-US stocks. AVDV is also roughly half the cost of the former option DLS.
Emerging Markets Small Cap Value – 5%
There’s currently no ideal fund for this very narrow segment of the global market. In June 2021, Avantis actually filed for an all-cap value fund for Emerging Markets (AVES launched in September, 2021) that'll likely have positive loading on the Size factor. We’ll see how its exposure shakes out in the future.
For now we’re using a small cap dividend fund from WisdomTree as a proxy for Value within small caps in Emerging Markets. Don’t let this sound discouraging. The fund also screens for strong financials and has appreciable loading across Size, Value, and Profitability. The fund is DGS, the WisdomTree Emerging Markets SmallCap Dividend Fund.
U.S. Momentum – 10%
Momentum is another factor, referring to a stock's price trend within a 12 month period. It is typically inversely correlated with Value. Whether or not Momentum funds can reliably deliver the factor premium is up for debate, but it should still offer a diversification benefit in terms of factor correlations.
Alpha Architect (Wes Gray) is probably the best name in the biz for Momentum. Their funds demonstrably provide superior exposure to Momentum, and they pay close attention to the trading costs and tax implications that usually kill the expected premium. Their ETF for U.S. Momentum is QMOM.
International Momentum – 10%
Alpha Architect's fund for international Momentum is IMOM.
U.S. Treasury Bonds (STRIPS) – 10%
No well-diversified portfolio is complete without bonds, even at low, zero, or negative interest rates.
Again, by diversifying across uncorrelated assets, we mean holding different assets that will perform well at different times. For example, when stocks zig, bonds tend to zag. Those 2 assets are uncorrelated. Holding both provides a smoother ride, reducing portfolio volatility (variability of return) and risk. We used the same concept above in relation to risk factor exposure. Now we're talking about entirely separate asset classes, but we're also taking advantage of a risk premium in fixed income: term. Again, I delved into this concept of asset diversification in detail in a separate post here.
STRIPS (Separate Trading of Registered Interest and Principal of Securities) are basically just bonds where the coupon payment is rolled into the price, so they are zero-coupon bonds. This means greater volatility. Here we're using a fund that is essentially just very long duration treasury bonds (25 years).
I can see the waves of comments coming in, which I see all the time on forums and Reddit threads:
- “Bonds are useless at low yields!”
- “Bonds are for old people!”
- “Long bonds are too volatile and too susceptible to interest rate risk!”
- “Corporate bonds pay more!”
- “Interest rates can only go up from here! Bonds will be toast!”
- “Bonds return less than stocks!”
So why long term treasuries? Here are my brief rebuttals to the above.
- Bond duration should be roughly matched to one's investing horizon, over which time a bond should return its par value plus interest. Betting on “safer,” shorter-term bonds with a duration shorter than your investing horizon could be described as market timing, which we know can't be done profitably on a consistent basis. This is also a potentially costlier bet, as yields tend to increase as we extend bond duration, and long bonds better counteract stock crashes. More on that in a second.
- Moreover, in regards to bond duration, we know market timing doesn't work with stocks, so why would we think it works with bonds and interest rates? Bonds have returns and interest payments. A bond's duration is the point at which price risk and reinvestment risk – the components of what we refer to as a bond's interest rate risk – are balanced. In this sense, though it may seem counterintuitive, matching bond duration to the investing horizon reduces interest rate risk and inflation risk for the investor. An increase in interest rates and subsequent drop in a bond's price is price risk. A decrease in interest rates means future coupons are reinvested at the lower rate; this is reinvestment risk. A bond's duration is an estimate of the precise point at which these two risks balance each other out to zero. If you have a long investing horizon and a short bond duration, you have more reinvestment risk and less price risk. If you have a short investing horizon and a long bond duration, you have less reinvestment risk and more price risk. Purposefully using one of these mismatches in expectation of specific interest rate behavior is intrinsically betting that your prediction of the future is better than the market's, which should strike you as unlikely.
- It is fundamentally incorrect to say that bonds must necessarily lose money in a rising rate environment. Bonds only suffer from rising interest rates when those rates are rising faster than expected. Bonds handle low and slow rate increases just fine; look at the period of rising interest rates between 1940 and about 1975, where bonds kept rolling at their par and paid that sweet, steady coupon.
- New bonds bought by a bond index fund in a rising rate environment will be bought at the higher rate, while old ones at the previous lower rate are sold off. You're not stuck with the same yield for your entire investing horizon. The reinvested higher yield makes up for any initial drop in price over the duration of the bond.
- We know that treasury bonds are an objectively superior diversifier alongside stocks compared to corporate bonds. This is also why I don't use the popular total bond market fund BND.
- At such a low allocation of 10%, we need and want the greater volatility of long-term bonds so that they can more effectively counteract the downward movement of stocks, which are riskier and more volatile than bonds. We're using them to reduce the portfolio's volatility and risk. More volatile assets make better diversifiers. The vast majority of the portfolio's risk is still being contributed by stocks. Using long bonds also provides some exposure to the term fixed income risk factor.
- We're not talking about bonds held in isolation, which would probably be a bad investment right now. We're talking about them in the context of a diversified portfolio alongside stocks, for which they are still the usual flight-to-safety asset during stock downturns. It has been noted that this uncorrelation of treasury bonds and stocks is even amplified during times of market turmoil, which researchers referred to as crisis alpha.
- Similarly, short-term decreases in bond prices do not mean the bonds are not still doing their job of buffering stock downturns.
- Bonds still offer the lowest correlation to stocks of any asset, meaning they're still the best diversifier to hold alongside stocks. Even if rising rates mean bonds are a comparatively worse diversifier (for stocks) in terms of expected returns during that period does not mean they are not still the best diversifier to use.
- Historically, when treasury bonds moved in the same direction as stocks, it was usually up.
- Long bonds have beaten stocks over the last 20 years. We also know there have been plenty of periods where the market risk factor premium was negative, i.e. 1-month T Bills beat the stock market – the 15 years from 1929 to 1943, the 17 years from 1966-82, and the 13 years from 2000-12. Largely irrelevant, but just some fun stats for people who for some reason think stocks always outperform bonds.
- Interest rates are likely to stay low for a while. Also, there’s no reason to expect interest rates to rise just because they are low. People have been claiming “rates can only go up” for the past 20 years or so and they haven't. They have gradually declined for the last 700 years without reversion to the mean. Negative rates aren't out of the question, and we're seeing them used in some foreign countries.
- Bond convexity means their asymmetric risk/return profile favors the upside.
- I acknowledge that post-Volcker monetary policy, resulting in falling interest rates, has driven the particularly stellar returns of the raging bond bull market since 1982, but I also think the Fed and U.S. monetary policy are fundamentally different since the Volcker era, likely allowing us to altogether avoid runaway inflation like the late 1970’s going forward. Stocks are also probably the best inflation “hedge” over the long term.
David Swensen summed it up nicely in his book Unconventional Success:
“The purity of noncallable, long-term, default-free treasury bonds provides the most powerful diversification to investor portfolios.”
Ok, bonds rant over.
For this piece, I'm using Vanguard's EDV, the Vanguard Extended Duration Treasury ETF.
TIPS – 10%
Stocks tend to be the best inflation “hedge” over the long term. But runaway inflation over the short term can still be damaging to portfolios for retirees or those with a shorter horizon. TIPS (Treasury Inflation Protected Securities) are the only asset directly linked to inflation; they are bonds whose price adjusts for inflation every 6 months.
Half the bond allocation of this portfolio is in TIPS, but we still want to match bond duration to time horizon, and longer duration bonds once again are more effective at smaller allocations, so we're using long term TIPS via PIMCO's fund LTPZ.
Gold – 20%
If you’ve read any of my other stuff around here, you know I’m not a huge fan of gold in terms of expected returns and its purported inflation “hedging.” However, I can’t argue with its uncorrelation to both stocks and bonds that offers a demonstrable diversification benefit, and I fully concede that holding gold is perfectly sensible and desirable for risk-averse investors, retirees, or those simply wanting to limit the portfolio’s volatility and drawdowns.
Let me reiterate and be very clear. Gold and bonds have lower expected returns than stocks. We are including them here as diversifiers. If stocks zig, bonds tend to zag, while gold zegs. We're covering all bases. The stocks portion will still likely drive most of the portfolio’s returns. The primary goal and purpose of this portfolio is to limit volatility and risk, and while we hope to not sacrifice too much performance in the process, it is sensible to expect to sacrifice some. If you are attempting to maximize expected returns irrespective of volatility and risk, this is not the portfolio for you.
Factor Tank Portfolio – Historical Performance
This backtest means nothing. It's only a few years, because a lot of these funds are very new.
I used some Dimensional funds to get an idea of what the Avantis funds may have looked like prior to their inception a year ago.
Here's 2016 through July, 2021:
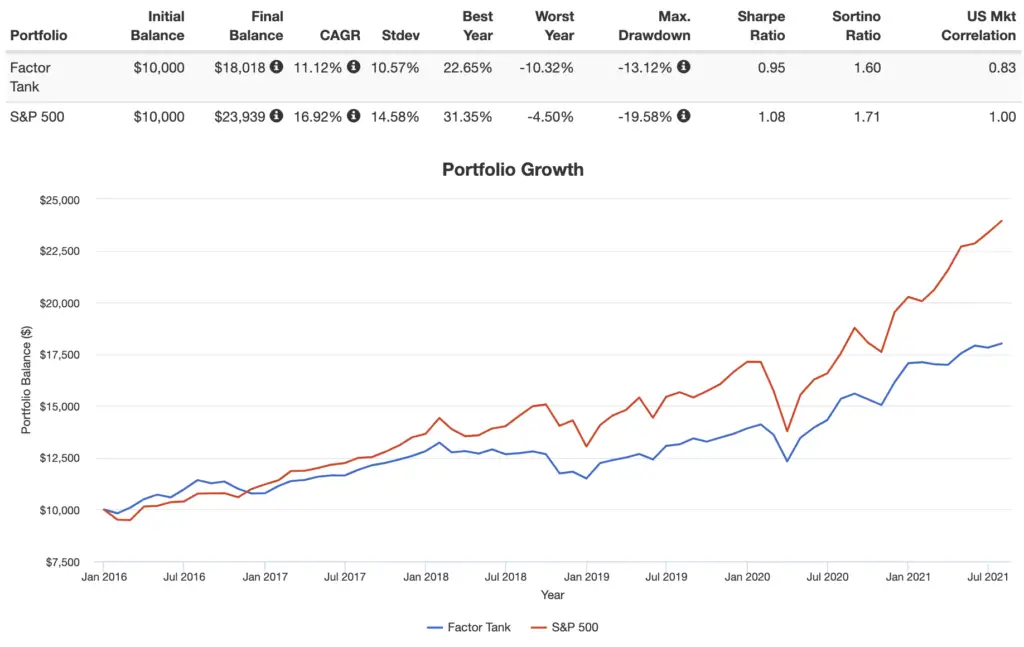
Forget the CAGR. Expected factor premia rely on long time periods, and Size and Value have both suffered in recent years. I'm more interested in the lower volatility and smaller drawdown by about 1/3 compared to the S&P 500. But again, even this doesn't mean too much from a period of only a few years. Don't draw any conclusions from this. Past performance doesn't indicate future performance anyway.
Factor Tank Portfolio Pie for M1 Finance
So putting the funds together, the resulting Factor Tank Portfolio looks like this:
- VT – 20%
- AVUV – 10%
- AVDV – 5%
- DGS – 5%
- QMOM – 10%
- IMOM – 10%
- EDV – 10%
- LTPZ – 10%
- SGOL – 20%
You can add this pie to your portfolio on M1 Finance by clicking this link and then clicking “Save to my account.”
I would probably rebalance it quarterly.
Questions, comments, concerns, criticisms? Let me know in the comments.
Disclosure: I am long AVUV, AVDV, DGS, and EDV in my own portfolio.
Interested in more Lazy Portfolios? See the full list here.
Disclaimer: While I love diving into investing-related data and playing around with backtests, this is not financial advice, investing advice, or tax advice. The information on this website is for informational, educational, and entertainment purposes only. Investment products discussed (ETFs, mutual funds, etc.) are for illustrative purposes only. It is not a research report. It is not a recommendation to buy, sell, or otherwise transact in any of the products mentioned. I always attempt to ensure the accuracy of information presented but that accuracy cannot be guaranteed. Do your own due diligence. I mention M1 Finance a lot around here. M1 does not provide investment advice, and this is not an offer or solicitation of an offer, or advice to buy or sell any security, and you are encouraged to consult your personal investment, legal, and tax advisors. Hypothetical examples used, such as historical backtests, do not reflect any specific investments, are for illustrative purposes only, and should not be considered an offer to buy or sell any products. All investing involves risk, including the risk of losing the money you invest. Past performance does not guarantee future results. Opinions are my own and do not represent those of other parties mentioned. Read my lengthier disclaimer here.

Are you nearing or in retirement? Use my link here to get a free holistic financial plan and to take advantage of 25% exclusive savings on financial planning and wealth management services from fiduciary advisors at Retirable to manage your savings, spend smarter, and navigate key decisions.


So much for interest rates should stay low for a while. Since this premise is most certainly not the case what do yu substitute for STRIPS? Expand allocation to TIPS?
What do you mean? It’s been less than a year. Rates are still extremely low. Let’s see where they are in 10 years. I’m not a short-term investor, thus I have no use for TIPS right now. Your situation may be different.
Stumbled on an interesting variation on this by combining a backtest of your RPAR recreation with the Factor Tank. portfolio and using Utilities instead of GNR…
25% Long Duration TIPS
15% Utilities
5% US Momentum
5% Itl Ex-US Momentum
9% US SCV
9% Itl Ex-US SCV
25% Extended Duration STRIPS
7% EM / EM Value
Backtested [Oct 2009 – Dec 2021]
Resulted in noticeably higher returns and lower standard deviation than both the RPAR recreation and the Factor Tank portfolio. Managed 10.11% CAGR with 8.34% Standard Deviation!
Also congratulations on the subscribe feature for the comments section! Good stuff.
I really enjoyed this post – super helpful to learn about the various factors and how they can be combined!
One quick question – where do you get the image of the color wheel with each asset by percentage? I’d like to create one for my own portfolio. Thanks!
Thanks, Rob! I just use Google Sheets and click Insert > Chart. Don’t tell anyone! 😉