Everyone always asks how I invest my own money. Some have basically pieced it together from various mentions across the blog, but I finally got around to laying it out in detail. I've named it the Ginger Ale Portfolio.
Interested in more Lazy Portfolios? See the full list here.
Disclosure: Some of the links on this page are referral links. At no additional cost to you, if you choose to make a purchase or sign up for a service after clicking through those links, I may receive a small commission. This allows me to continue producing high-quality content on this site and pays for the occasional cup of coffee. I have first-hand experience with every product or service I recommend, and I recommend them because I genuinely believe they are useful, not because of the commission I may get. Read more here.
Contents
Foreword – A Brief History of My Investing Journey
I hate when recipe websites tell an unnecessary, long-winded story before getting to the recipe, so feel free to skip straight to the portfolio by clicking here.
Starting around age 18, I spun my wheels for nearly a decade stock picking and trading options on TradeKing (which Ally later acquired), usually underperforming the market. I was naive and egotistical enough to think that I could outsmart and out-analyze other traders, at least on average.
Unfortunately, a math degree with a focus in statistics strengthened my faulty conviction for a few more years before I finally converted to index investing. Thinking back on that time and the way I traded (I don't think I can even call it investing) makes me cringe now, so these days I try to do whatever I can to help others – particularly new, young investors – avoid those same pitfalls I succumbed to. I'd be much further ahead now had I just indexed from the start.
Since I had previously only traded U.S. securities and entirely ignored international assets, when I converted to index investing, I went 100% VTI for the total U.S. stock market (U.S. companies do business overseas, right?) and wrote myself an Investment Policy Statement (IPS) to avoid stock picking as a hard rule going forward. I was also still tempted to try to time the market using macroeconomic indicators and by selectively overweighting sectors around this time before realizing that sector bets are just stock picking lite, market timing tends to be more harmful than helpful, and the broad index fund does the self-cleansing and sector rearranging for me.
Then I dug deeper into the Bogleheads philosophy and realized I was still being ignorant by avoiding international stocks (more on this below), so I decided to throw in some VXUS at about 80/20 U.S. to international. I kept reading and researching and digging and concluded that I still had way too much home country bias. The U.S. is only one country out of many around the world! So I switched to 100% VT. Global stock market, market cap weighted. Can't go wrong. And “100% VT” would still be my elevator answer for a young investor just starting out.
Then I got further into the nuances of evidence-based investing as well as the important behavioral aspects of investing and what the research had to say about these things – Fama and French, Markowitz and MPT, efficient markets, leverage, Black and Scholes, Merton Miller, asset allocation, risk tolerance, sequence risk, factors, dividend irrelevance, asset correlations, risk management, etc.
I started realizing that, in short, 100% VT is objectively suboptimal in terms of both expected returns and portfolio risk. Emerging Markets only comprise 11% of the global market. Small cap stocks make up an even smaller fraction. And we should probably avoid small cap growth stocks. And certain funds have superior exposure to Value than others based on their underlying index's selection methodology. And can I stomach the drawdowns that accompany a 100% cap weighted stocks position during a crash? This line of thinking led me to books and lazy portfolios from present-day advisors like William Bernstein, Larry Swedroe, Ray Dalio, Paul Merriman, and Rick Ferri, all of whom influenced my thought process and subsequent portfolio construction.
I also realized there's an observable tradeoff between simplicity and optimization. I'm a tinkerer by nature and tend to default to the latter, probably to a fault (i.e. overfitting and data mining), which is why this blog's name is what it is, for better or for worse. People say indexing is boring, but it doesn't have to be. There's still plenty of learning to be had, and subsequent research-backed improvements to be made in the pursuit of optimization if you choose to tinker.
But don't get me wrong. Simplicity is – and probably should be – a desirable characteristic of one's portfolio for most people. Whatever allows you to sleep at night, stay the course, and not tinker during market downturns is the best strategy for you. It can take some time (and probably a market crash) to figure out what that strategy is. The portfolio below will seem “simple” to a stock picker with 100 holdings; it may seem complex to the indexer who is 100% VT.
So below I've pieced together what I think is optimal for me, based on my understanding of what the research thus far has to say about expected returns, volatility, diversification, risk, cognitive biases, and reliability of outcome, all while realizing I may get it wrong and that I may want to change it in the future.
About the Ginger Ale Portfolio
Update July 2021: Got way too many emails from people using this portfolio and then asking me about TIPS and Emerging Markets gov't bonds (what they are, what they're for, etc.). They clearly didn't understand what they were buying. That's not good. So I removed those pieces.
I'm bad at thinking of clever names for things. When writing posts, I usually sip on a can of ginger ale, so the Ginger Ale Portfolio seemed like an appropriate name.
Aside from “lottery ticket” fun money in the Hedgefundie Adventure and my taxable account in NTSX, this portfolio is basically how my “safe” money is invested. Leverage, while perhaps useful on paper for any investor, is probably not appropriate for most investors purely because of the emotional and psychological fortitude its usage requires during market turmoil.
Thus, for a one-size-fits-most portfolio, I can't in good conscience just recommend a leveraged fund. Moreover, whatever I put below will likely just be blindly copied by many novice investors who won't even bother reading or understanding the details, so I have to take that fact into consideration and be at least somewhat responsible.
This portfolio is 90/10 stocks to fixed income using a long duration bond fund to, again, accommodate sort of a one-size-fits-most asset allocation for multiple time horizons and risk tolerances. I'd call it medium risk simply because it has some allocation to fixed income. It is a lazy portfolio designed to match or beat the market return with lower volatility and risk.
It heavily tilts toward small cap value to diversify the portfolio's factor exposure. It is also diversified across geographies and asset classes. Specifically, this portfolio is roughly 1:1 large caps to small caps and for U.S. investors, it has a slight home country bias of 5:4 U.S. to international, nearly matching global market weights.
In selecting specific funds, I looked for sufficient liquidity, appreciable factor loading (where the expected premium would outweigh the fee), low tracking error, and low fees.
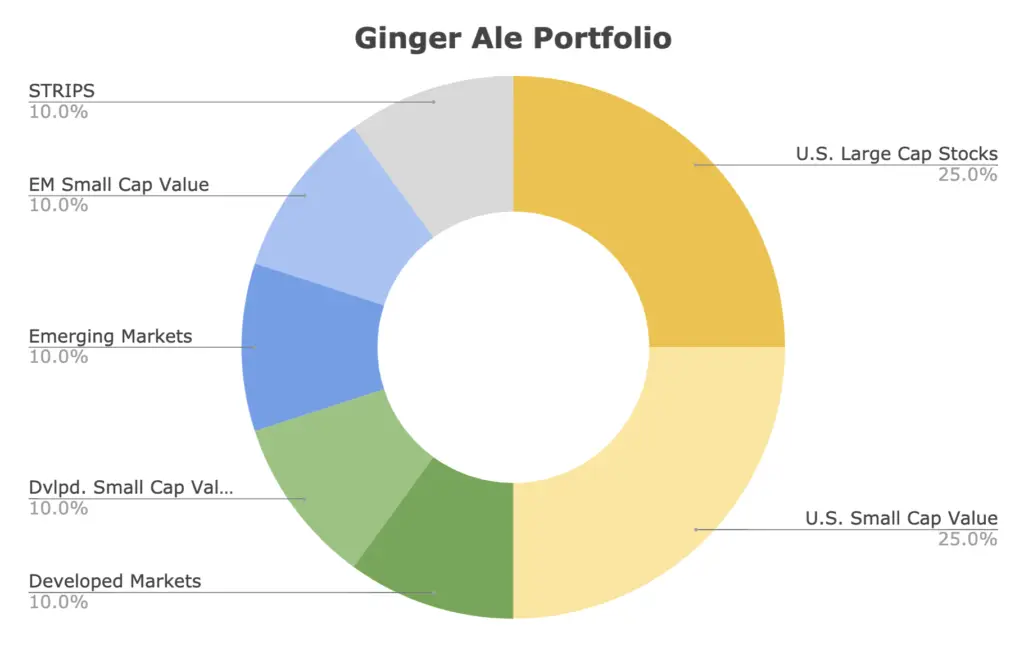
Here's what it looks like:
Ginger Ale Portfolio Allocations:
- 25% U.S. Large Cap Stocks
- 25% U.S. Small Cap Value
- 10% Developed Markets (ex-US)
- 10% Developed Markets (ex-US) Small Cap Value
- 10% Emerging Markets
- 10% Emerging Markets Small Cap Value
- 10% U.S. Treasury STRIPS
Below I'll explain the reasoning behind each asset in detail.
U.S. Large Cap Stocks – 25%
Most lazy portfolios use U.S. stocks – and specifically large-cap U.S. stocks – as a “base.” This one is no different, but they're still only at 25%. You'll see why later.
Not much to explain here. The U.S. stock market comprises a little over half of the global stock market and has outperformed foreign stocks historically. I don't feel comfortable going completely small caps for the equities side so we're keeping large caps here to diversify across cap sizes, as large stocks beat small stocks during certain periods, while small stocks beat large stocks over other periods.
This segment captures household names like Amazon, Apple, Google, Johnson & Johnson, Microsoft, etc. Specifically, we're using the S&P 500 Index – considered a sufficient barometer for “the market” – via Vanguard's VOO.
Why not use VTI to capture the entire U.S. stock market including some small- and mid-caps? I'll answer that in the next section.
U.S. Small Cap Value – 25%
I don't use VTI (total U.S. stock market) because I want to avoid those pesky small-cap growth stocks which don't tend to pay a risk premium. Even mid-cap growth hasn't beaten large cap blend on a risk-adjusted basis. Using VTI would also dilute my target large cap exposure.
Specifically, small cap growth stocks are the worst-performing segment of the market and are considered a “black hole” in investing. The Size factor premium – small stocks beat large stocks – seems to only apply in small cap value. As Cliff Asness from AQR says, “Size matters, if you control your junk.” Basically, if you want to bet on small caps, the evidence suggests you want to do so in small cap value, preferably while also screening for profitability.
By “risk premium,” I'm referring to the independent sources of risk identified by Fama and French (and others) that we colloquially call “factors.” Examples include Beta, Size, Value, Profitability, Investment, and Momentum. I delved into those details in a separate post that I won't repeat here, but I'll be referring to these factors and their benefits quite a few times below. Though it may sound like magic, the evidence suggests that overweighting these independent risk factors both increases expected returns over the long term and decreases portfolio risk by diversifying the specific sources of that risk, as the factors are lowly correlated to each other and thus show up at different times. The reason I don't want to go 100% factors like Larry Swedroe is because A) I don't have the stomach and conviction he has, and B) there's always the possibility of being wrong.
I know the exclusion of mid-caps entirely seems bizarre at first glance too. Factor premia tend to get larger and more statistically significant as you go smaller. That is, ideally you want to factor tilt within the small cap universe. That's exactly what we're doing here by basically taking a barbell approach in U.S. equities: using large caps and small caps to put the risk targeting exactly where we want it while still diversifying across cap sizes and equity styles. Essentially, we're letting large caps be our Growth exposure in the U.S. and consciously avoiding small- and mid-cap growth stocks.
In short, small cap value stocks have smoked every other segment of the market historically thanks to the Size and Value factor premiums. “Value” refers to underpriced stocks relative to their book value. Basically, cheaper, sometimes crappier, downtrodden stocks have greater expected returns. Small cap value stocks are smaller and more value-y than mid-cap value stocks. Thus, no mid-caps. (As an aside, Alpha Architect basically takes this idea to the extreme – finding the absolute smallest, cheapest stocks and concentrating in only 50 of them; talk about a wild ride.)
I don't want it to seem like I think this is some profound, contrarian approach. Using VTI (total stock market) instead of VOO (S&P 500) would be perfectly fine, and at only 25% of the portfolio, the difference is admittedly probably negligible. The simple point is that I've already decided on a specific small cap allocation, and I'm choosing to get that exposure through a dedicated small cap value fund rather than through VTI. Similarly, I've also already decided on a specific “pure,” undiluted large cap allocation, and I'm choosing to get that exposure through the S&P 500 Index.
Previously, the S&P Small Cap 600 Value index (VIOV, SLYV, IJS) was basically the gold standard for the U.S. small cap value segment. AVUV, the new kid on the block from Avantis, has provided some extremely impressive exposure – superior to that of those funds – in its relatively short lifespan thus far, so much so that it recently replaced VIOV in my own portfolio. I went into detail about this in a separate “small value showdown” post here. In a nutshell, it has been able to capture smaller, cheaper stocks than its competitors, with convenient exposure to the Profitability factor, all while considering Momentum in its trades, and we would expect the premium to more than make up for its slightly higher fee.
Including small caps also took the famous 4% Rule up to 4.5% historically.
Developed Markets – 10%
Developed Markets refer to developed countries outside the U.S. – Australia, Canada, Germany, the UK, France, Japan, etc.
At its global weight, the U.S. only comprises about half of the global stock market. Most U.S. investors severely overweight U.S. stocks (called home country bias) and have an irrational fear of international stocks.
If you're reading this, chances are you're in the U.S. As I just pointed out, odds are favorable that you also overweight – or only have exposure to – U.S. stocks in your portfolio. The U.S. is one single country out of many in the world. By solely investing in one country's stocks, the portfolio becomes dangerously exposed to the potential detrimental impact of that country's political and economic risks. If you are employed in the U.S., it's likely that your human capital is highly correlated with the latter. Holding stocks globally diversifies these risks and thus mitigates their potential impact.
Moreover, no single country consistently outperforms all the others in the world. If one did, that outperformance would also lead to relative overvaluation and a subsequent reversal. During the period 1970 to 2008, an equity portfolio of 80% U.S. stocks and 20% international stocks had higher general and risk-adjusted returns than a 100% U.S. stock portfolio. Specifically, international stocks outperformed the U.S. in the years 1986-1988, 1993, 1999, 2002-2007, 2012, and 2017. For the famous “lost decade” of 2000-2009 when U.S. stocks were down 10% for the period, international Developed Markets were up 13%.
For U.S. investors, holding international stocks is also a way to diversify currency risk and to hedge against a weakening U.S. dollar, which has been gradually declining for decades. International stocks tend to outperform U.S. stocks during periods when the value of the U.S. dollar declines sharply, and U.S. stocks tend to outperform international stocks during periods when the value of the U.S. dollar rises. Just like with the stock market, it is impossible to predict which way a particular currency will move next.
Moreover, U.S. stocks' outperformance on average over the past half-century or so has simply been due to increasing price multiples, not an improvement in business fundamentals. That is, U.S. companies did not generate more profit than international companies; their stocks just got more expensive. And remember what we know about expensiveness: cheap stocks have greater expected returns and expensive stocks have lower expected returns.
Dalio and Bridgewater maintain that global diversification in equities is going to become increasingly important given the geopolitical climate, trade and capital dynamics, and differences in monetary policy. They suggest that it is now even less prudent to assume a preconceived bet that any single country will be the clear winner in terms of stock market returns.
In short, geographic diversification in equities has huge potential upside and little downside for investors.
I went into the merits of international diversification in even more detail in a separate post here if you're interested.
Vanguard offers a low-cost fund called the Vanguard FTSE Developed Markets ETF. Its ticker is VEA.
Developed Markets (ex-US) Small Cap Value – 10%
We can also specifically target small cap value in ex-US Developed Markets stocks. It costs a bit more to do so, and some who tilt small cap value in the U.S. don't feel the need to do so in foreign stocks, but I think it's a prudent move considering the factor premia – in this case Size and Value – have shown up at different time periods across different geographies throughout history.
Remember we also get a diversification benefit here in doing so; it's not just for the greater expected returns. The earnings of large international corporations are more closely tied to global market forces, whereas smaller companies are more affected by local, idiosyncratic economic conditions. This means they are perfectly correlated with neither their large-cap counterparts nor with U.S. stocks.
Until just about a year ago, an expensive dividend fund from WisdomTree (DLS) was arguably the best way to access this segment of the global market. Now, Avantis has launched a fund available to retail investors that specifically targets international small cap value – AVDV. It is the only fund available to the public that specifically targets Size and Value (and conveniently, Profitability) in ex-US stocks. AVDV is also roughly half the cost of the former option DLS.
Emerging Markets – 10%
Emerging Markets refer to developing countries – China, Taiwan, India, Brazil, Thailand, etc.
Investors sometimes shy away from these countries due to their unfamiliarity and greater risk. I would argue that makes them more attractive. Stocks in these countries have paid a significant risk premium historically, compensating investors for taking on their greater risk.
Arguably more importantly, Emerging Markets tend to have a reliably lower correlation to U.S. stocks compared to Developed Markets, and thus are a superior diversifier. Of course, we would expect this, as these developing countries have unique risks – regulatory, liquidity, political, financial transparency, currency, etc. – that do not affect developed countries, or at least not the same extent. I delved into this in a little more detail here. For the previously mentioned “lost decade” of 2000-2009 when the S&P 500 delivered a negative 10% return, Emerging Markets stocks were up 155%.
Emerging Markets only comprise about 11% of the global stock market. This is why I don't use the popular VXUS (total international stock market) – because its ratio of Developed Markets to Emerging Markets is about 3:1. Here we're using a 1:1 ratio of Developed to Emerging Markets.
Vanguard's Emerging Markets ETF is VWO.
Emerging Markets Small Cap Value – 10%
Just like we just did with Developed Markets above, we can focus in on small cap value stocks within Emerging Markets as well.
Here we’re using a small cap dividend fund from WisdomTree as a proxy for Value within small caps in Emerging Markets. Don’t let this sound discouraging. The fund also screens for liquidity and strong financials and has appreciable loadings across Size, Value, and Profitability. Factor investors are wise to this fact, as this fund boasts nearly $3 billion in assets.
The fund is DGS, the WisdomTree Emerging Markets SmallCap Dividend Fund.
Factor investors like myself thought AVES, Avantis’s newest offering for more aggressive factor tilts in Emerging Markets, might dethrone DGS when it launched in late 2021. While it’s certainly no slouch and would still be a fine choice, I still prefer the looks of DGS, even with its higher fee. I compared these specifically here.
U.S. Treasury STRIPS – 10%
No well-diversified portfolio is complete without bonds, even at low, zero, or negative interest rates.
By diversifying across uncorrelated assets, we mean holding different assets that will perform well at different times. For example, when stocks zig, bonds tend to zag. Those 2 assets are uncorrelated. Holding both provides a smoother ride, reducing portfolio volatility (variability of return) and risk. We used the same concept above in relation to risk factor exposure. Now we're talking about entirely separate asset classes, but we're also taking advantage of a risk premium in fixed income: term. I delved into the concept of asset diversification in detail in a separate post here.
STRIPS (Separate Trading of Registered Interest and Principal of Securities) are basically just bonds where the coupon payment is rolled into the price, so they are zero-coupon bonds. Here we're using a fund that is essentially just very long duration treasury bonds (25 years).
I can see the waves of comments coming in, which I see all the time on forums and Reddit threads:
- “Bonds are useless at low yields!”
- “Bonds are for old people!”
- “Long bonds are too volatile and too susceptible to interest rate risk!”
- “Corporate bonds pay more!”
- “Interest rates can only go up from here! Bonds will be toast!”
- “Bonds return less than stocks!”
So why long term treasuries? Here are my brief rebuttals to the above.
- Bond duration should be roughly matched to one's investing horizon, over which time a bond should return its par value plus interest. Betting on “safer,” shorter-term bonds with a duration shorter than your investing horizon could be described as market timing, which we know can't be done profitably on a consistent basis. This is also a potentially costlier bet, as yields tend to increase as we extend bond duration, and long bonds better counteract stock crashes. More on that in a second.
- Moreover, in regards to bond duration, we know market timing doesn't work with stocks, so why would we think it works with bonds and interest rates? Bonds have returns and interest payments. A bond's duration is the point at which price risk and reinvestment risk – the components of what we refer to as a bond's interest rate risk – are balanced. In this sense, though it may seem counterintuitive, matching bond duration to the investing horizon reduces interest rate risk and inflation risk for the investor. An increase in interest rates and subsequent drop in a bond's price is price risk. A decrease in interest rates means future coupons are reinvested at the lower rate; this is reinvestment risk. A bond's duration is an estimate of the precise point at which these two risks balance each other out to zero. If you have a long investing horizon and a short bond duration, you have more reinvestment risk and less price risk. If you have a short investing horizon and a long bond duration, you have less reinvestment risk and more price risk. Purposefully using one of these mismatches in expectation of specific interest rate behavior is intrinsically betting that your prediction of the future is better than the market's, which should strike you as unlikely.
- It is fundamentally incorrect to say that bonds must necessarily lose money in a rising rate environment. Bonds only suffer from rising interest rates when those rates are rising faster than expected. Bonds handle low and slow rate increases just fine; look at the period of rising interest rates between 1940 and about 1975, where bonds kept rolling at their par and paid that sweet, steady coupon.
- Bond pricing does not happen in a vacuum. Here are some more examples of periods of rising interest rates where long bonds delivered a positive return:
- From 1992-2000, interest rates rose by about 3% and long treasury bonds returned about 9% annualized for the period.
- From 2003-2007, interest rates rose by about 4% and long treasury bonds returned about 5% annualized for the period.
- From 2015-2019, interest rates rose by about 2% and long treasury bonds returned about 5% annualized for the period.
- New bonds bought by a bond index fund in a rising rate environment will be bought at the higher rate, while old ones at the previous lower rate are sold off. You're not stuck with the same yield for your entire investing horizon. The reinvested higher yield makes up for any initial drop in price over the duration of the bond.
- We know that treasury bonds are an objectively superior diversifier alongside stocks compared to corporate bonds. This is also why I don't use the popular total bond market fund BND.
- At such a low allocation of 10%, we need and want the greater volatility of long-term bonds so that they can more effectively counteract the downward movement of stocks, which are riskier and more volatile than bonds. We're using them to reduce the portfolio's volatility and risk. More volatile assets make better diversifiers. The vast majority of the portfolio's risk is still being contributed by stocks. Using long bonds also provides some exposure to the term fixed income risk factor.
- We're not talking about bonds held in isolation, which would probably be a bad investment right now. We're talking about them in the context of a diversified portfolio alongside stocks, for which they are still the usual flight-to-safety asset during stock downturns. It has been noted that this uncorrelation of treasury bonds and stocks is even amplified during times of market turmoil, which researchers referred to as crisis alpha.
- Similarly, short-term decreases in bond prices do not mean the bonds are not still doing their job of buffering stock downturns.
- Bonds still offer the lowest correlation to stocks of any asset, meaning they're still the best diversifier to hold alongside stocks. Even if rising rates mean bonds are a comparatively worse diversifier (for stocks) in terms of expected returns during that period does not mean they are not still the best diversifier to use.
- Historically, when treasury bonds moved in the same direction as stocks, it was usually up.
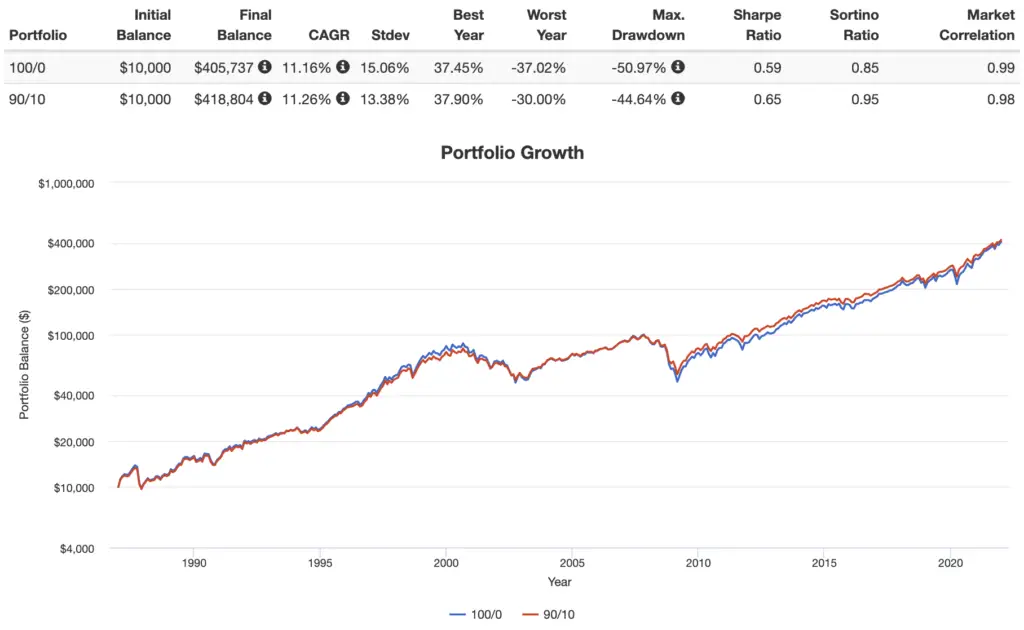
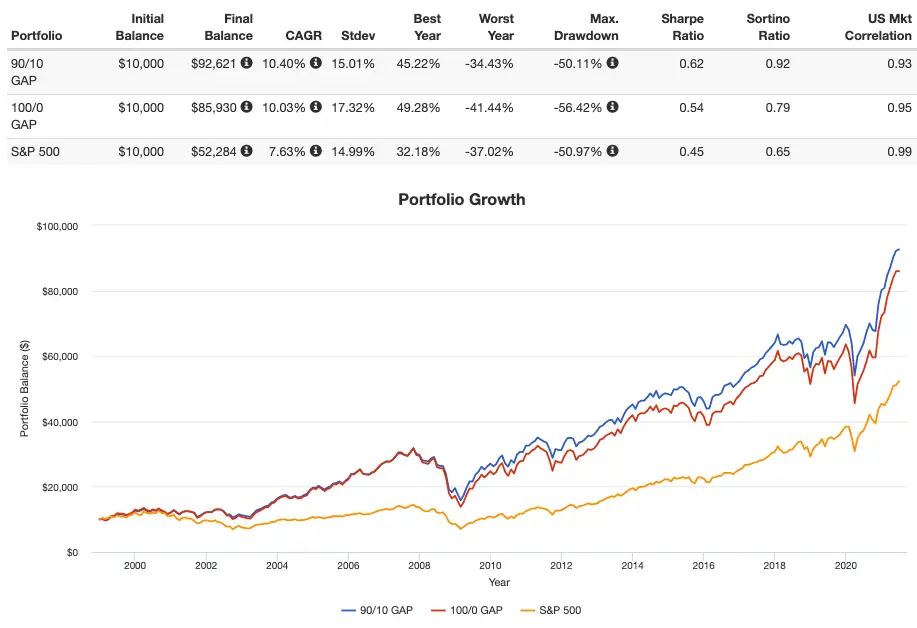
- Long bonds have beaten stocks over the last 20 years. We also know there have been plenty of periods where the market risk factor premium was negative, i.e. 1-month T Bills beat the stock market – the 15 years from 1929 to 1943, the 17 years from 1966-82, and the 13 years from 2000-12. Largely irrelevant, but just some fun stats for people who for some reason think stocks always outperform bonds. Also note how I've shown below that a 90/10 portfolio using STRIPS outperformed a 100% stocks portfolio on both a general and risk-adjusted basis for the period 1987-2021.
- Interest rates are likely to stay low for a while. Also, there’s no reason to expect interest rates to rise just because they are low. People have been claiming “rates can only go up” for the past 20 years or so and they haven't. They have gradually declined for the last 700 years without reversion to the mean. Negative rates aren't out of the question, and we're seeing them used in some foreign countries.
- Bond convexity means their asymmetric risk/return profile favors the upside.
- I acknowledge that post-Volcker monetary policy, resulting in falling interest rates, has driven the particularly stellar returns of the raging bond bull market since 1982, but I also think the Fed and U.S. monetary policy are fundamentally different since the Volcker era, likely allowing us to altogether avoid runaway inflation like the late 1970’s going forward. Stocks are also probably the best inflation “hedge” over the long term.
Here's that backtest mentioned above showing a 90/10 portfolio using STRIPS beating a 100% stocks portfolio for 1987-2021:
David Swensen summed it up nicely in his book Unconventional Success:
“The purity of noncallable, long-term, default-free treasury bonds provides the most powerful diversification to investor portfolios.”
Ok, bonds rant over.
For this piece, I'm using Vanguard's EDV, the Vanguard Extended Duration Treasury ETF.
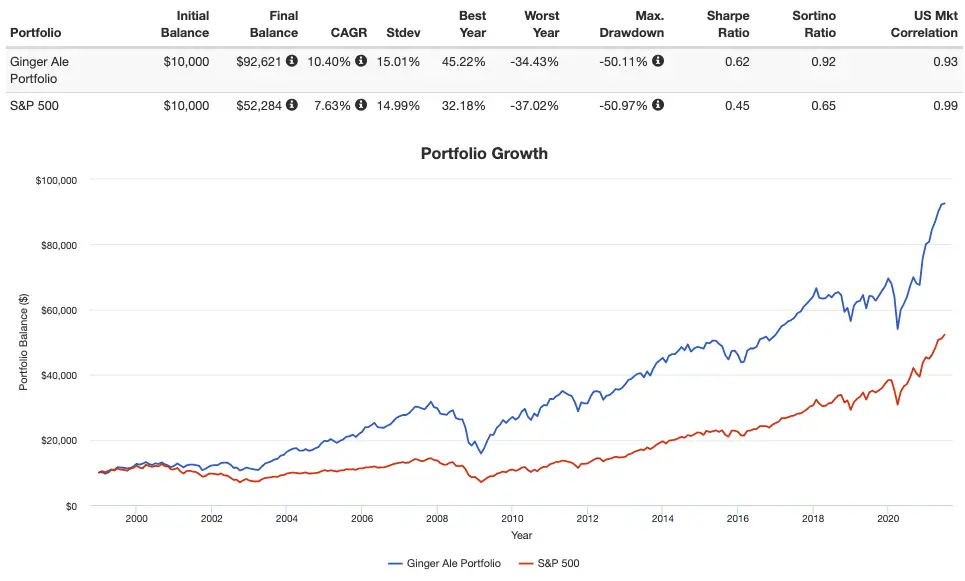
Ginger Ale Portfolio – Historical Performance
Some of these funds are pretty new, so I had to use comparable mutual funds from Dimensional in some cases to extend this backtest and give us a rough idea of how this thing would have performed historically. The furthest I could get was 1998, going through June 2021:
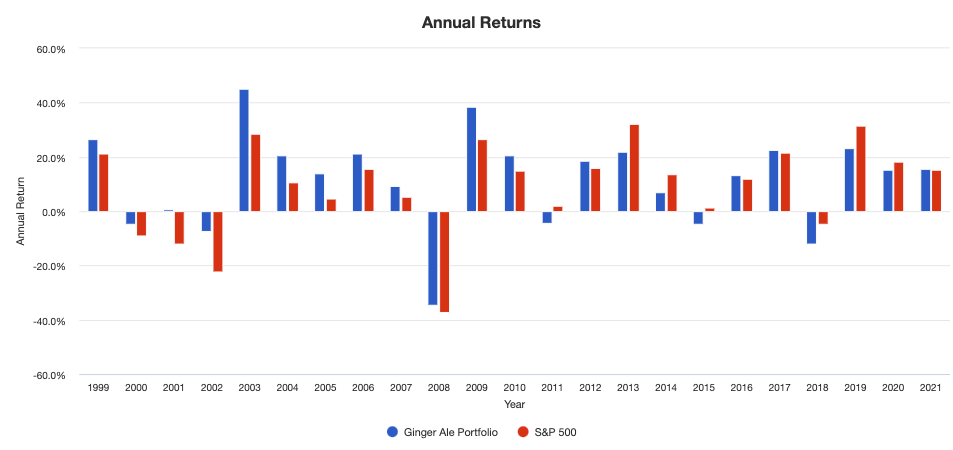
Here are the annual returns:
Here are the rolling returns:
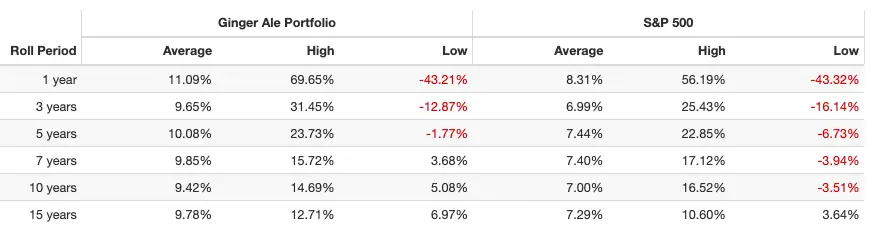
Keep in mind the Size and Value premia and international stocks suffered for the decade 2010-2020, otherwise I think the differences in performance metrics would have been even greater.
Ginger Ale Portfolio Pie for M1 Finance
So putting the funds together, the resulting Ginger Ale Portfolio looks like this:
- VOO – 25%
- AVUV – 25%
- VEA – 10%
- AVDV – 10%
- VWO – 10%
- DGS – 10%
- EDV – 10%
You can add this pie to your portfolio on M1 Finance by clicking this link and then clicking “Save to my account.”
Canadians can find the above ETFs on Questrade or Interactive Brokers. Investors outside North America can use Interactive Brokers.
Being More Aggressive with 100% Stocks
I'd like to think I made a pretty good case for why you shouldn't fear bonds, but if you're young and/or you have a very high risk tolerance, you might still be itching to ditch the bonds and go 100% stocks. Here's a more aggressive version, basically giving an extra 5% each to VOO and AVUV for more of a U.S. tilt:
- VOO – 30%
- AVUV – 30%
- VEA – 10%
- AVDV – 10%
- VWO – 10%
- DGS – 10%
Here's the pie link for that one.
Just note that historically this would have resulted in worse performance than the original 90/10:
Incorporating NTSX, NTSI, NTSE
A lot of people know I'm a huge fan of WisdomTrees line of “Efficient Core” funds like NTSX and have explicitly asked about replacing the stocks index funds from the aggressive version with these new 90/60 funds from WisdomTree, so I've added this section to briefly address that. If this idea sounds foreign to you, maybe go read this post that explains how NTSX works first and then come back here.
Making those substitutions of the WisdomTree Efficient Core Funds (NTSX, NTSI, and NTSE) for the broad index funds for the S&P 500 (VOO), ex-US Developed Markets (VEA), and Emerging Markets (VWO) is absolutely fine, but I've tried to explain to a few people in the comments that this doesn't materially change the exposure too much from the original Ginger Ale Portfolio simply because EDV packs quite a volatile punch since it's extended duration treasury bonds. That was the whole point of its inclusion.
In other words, going 6x on intermediate treasury bonds (what the WisdomTree funds do) is nearly the same exposure as what EDV provides.
This is illustrated in the backtest below that shows the original Ginger Ale Portfolio, the aggressive 100% stocks version, and a version substituting in NTSX/NTSI/NTSE that delivers effective exposure of 95/35:
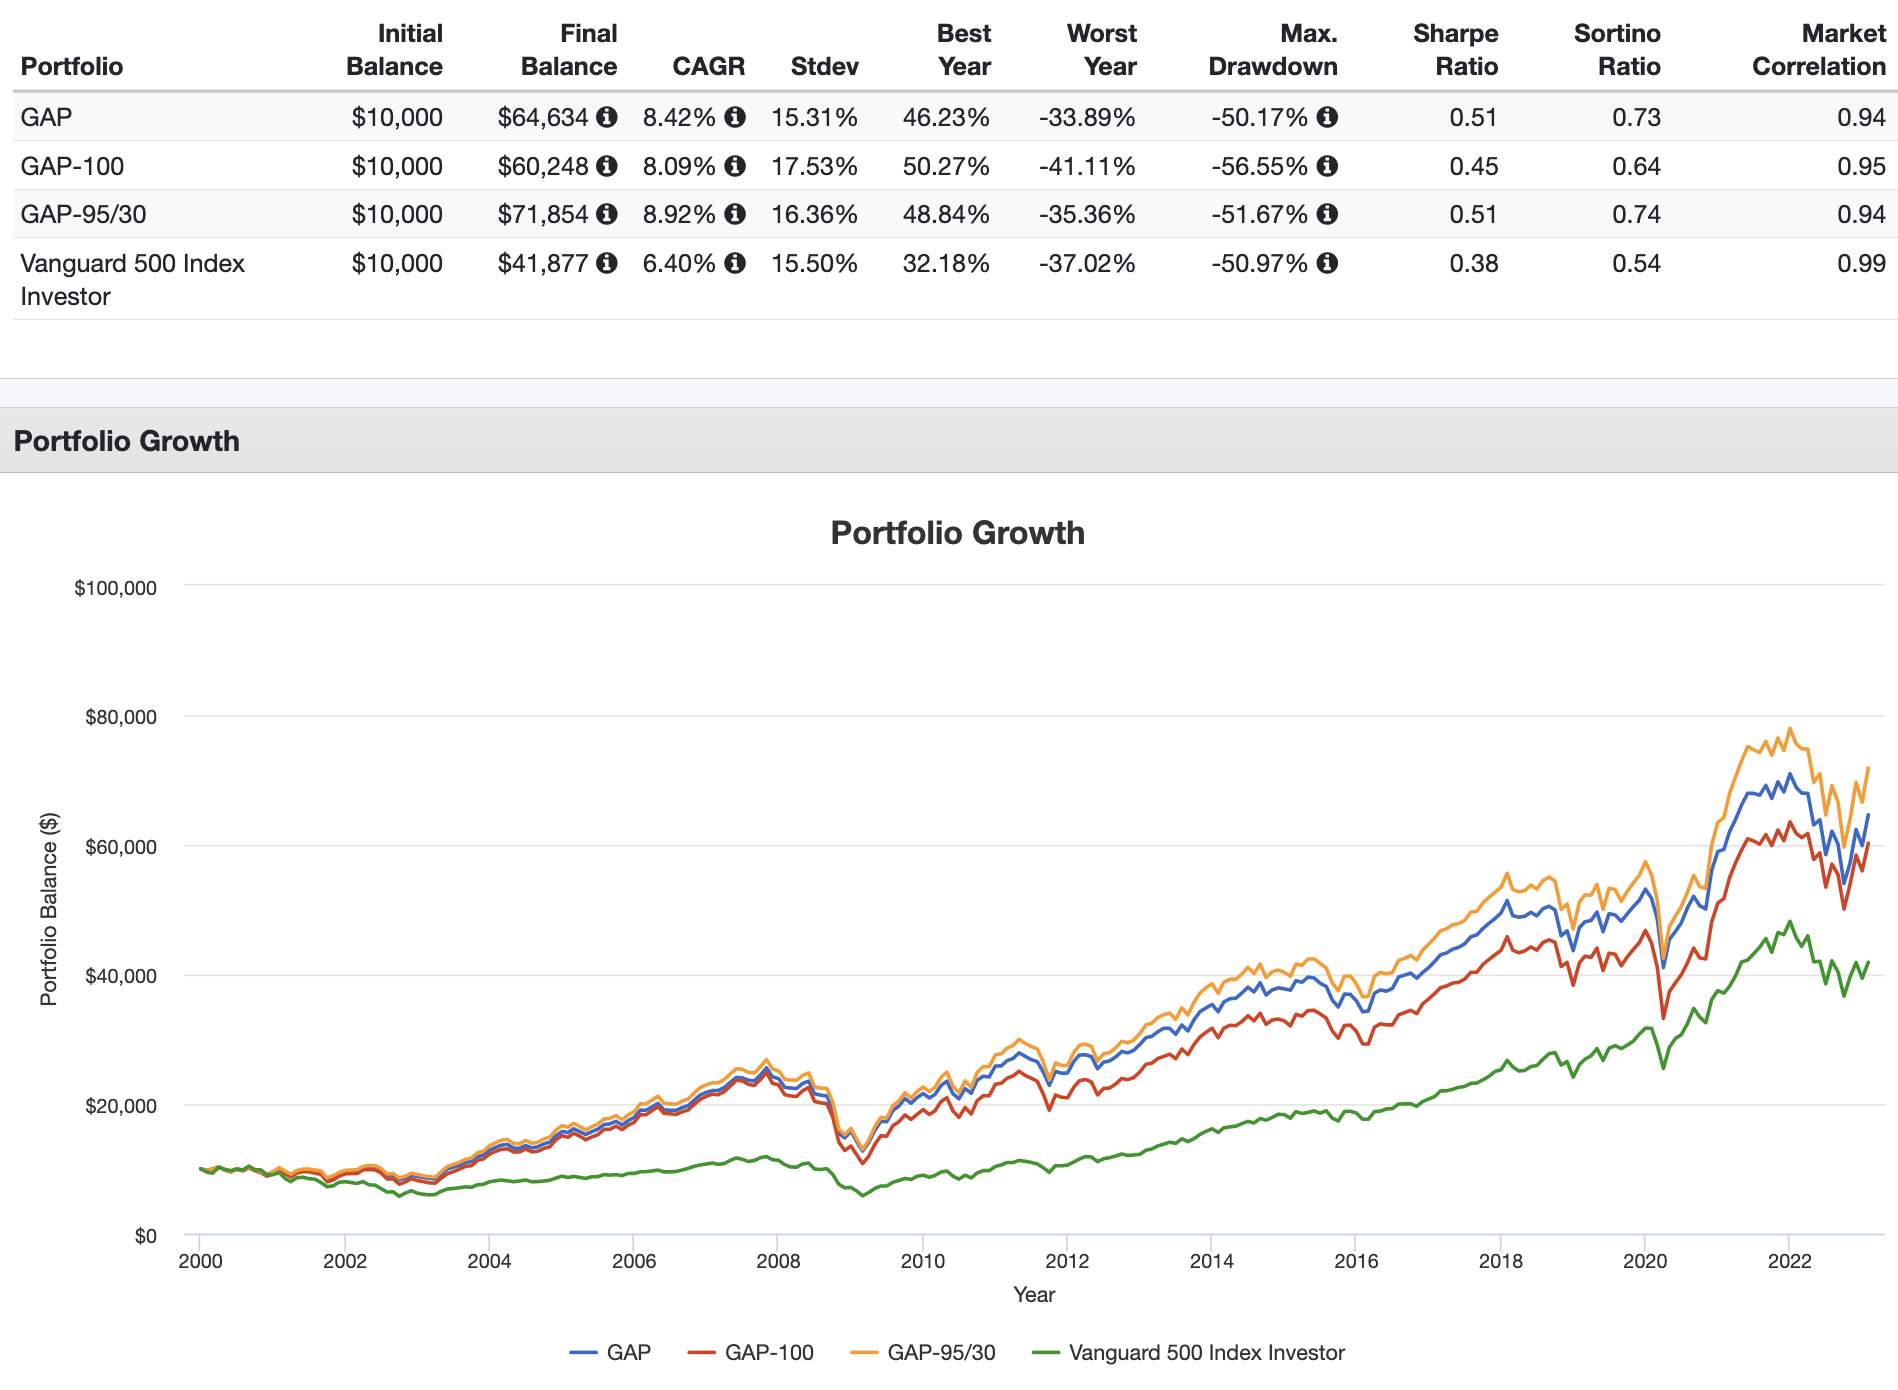
Making those substitutions, that 95/30 portfolio looks like this:
NTSX – 30%
AVUV – 30%
NTSI – 10%
AVDV – 10%
NTSE – 10%
DGS – 10%
Also keep in mind this one has a much greater expense ratio. You can get this pie here.
Adjusting This Portfolio For Retirement
I've also had a lot of people ask me how I plan to adjust this portfolio as I near and enter retirement. The answer is pretty simple and straightforward. I don't care about dividends or using them as income, so I plan to simply decrease stocks, increase bonds, decrease bond duration, add some TIPS, and sell shares as needed. Factor tilts and geographical diversification would remain intact.
For example, a 40/60 version using intermediate nominal and real bonds might look something like this:
- 10% VOO – U.S. Large Caps
- 10% AVUV – U.S. Small Cap Value
- 5% VEA – Developed Markets (ex-US)
- 5% AVDV – Developed Markets (ex-US) Small Cap Value
- 5% VWO – Emerging Markets
- 5% DGS – Emerging Markets Small Cap Value
- 30% VGIT – Intermediate U.S. Treasury Bonds
- 30% SCHP – Intermediate TIPS
That pie is here if you want it for some reason.
Are you nearing or in retirement? Use my link here to get a free holistic financial plan and to take advantage of 25% exclusive savings on financial planning and wealth management services from fiduciary advisors at Retirable to manage your savings, spend smarter, and navigate key decisions.

Questions, comments, concerns, criticisms? Let me know in the comments.
Disclosure: I am long VOO, AVUV, VEA, VWO, AVDV, DGS, and EDV.
Interested in more Lazy Portfolios? See the full list here.
Disclaimer: While I love diving into investing-related data and playing around with backtests, this is not financial advice, investing advice, or tax advice. The information on this website is for informational, educational, and entertainment purposes only. Investment products discussed (ETFs, mutual funds, etc.) are for illustrative purposes only. It is not a research report. It is not a recommendation to buy, sell, or otherwise transact in any of the products mentioned. I always attempt to ensure the accuracy of information presented but that accuracy cannot be guaranteed. Do your own due diligence. I mention M1 Finance a lot around here. M1 does not provide investment advice, and this is not an offer or solicitation of an offer, or advice to buy or sell any security, and you are encouraged to consult your personal investment, legal, and tax advisors. Hypothetical examples used, such as historical backtests, do not reflect any specific investments, are for illustrative purposes only, and should not be considered an offer to buy or sell any products. All investing involves risk, including the risk of losing the money you invest. Past performance does not guarantee future results. Opinions are my own and do not represent those of other parties mentioned. Read my lengthier disclaimer here.
Are you nearing or in retirement? Use my link here to get a free holistic financial plan and to take advantage of 25% exclusive savings on financial planning and wealth management services from fiduciary advisors at Retirable to manage your savings, spend smarter, and navigate key decisions.

If you had to pick a single fund that is as close as possible to this portfolio, what would it be? Anything reasonably close? If not, would the 3 Fund Portfolio be the simplest/closest substitute?
One fund: AVGE
Three funds: VOO, AVUV, DFAX
Do you have the equivalent Fidelity Funds to make this portfolio
Hi,
It’s been asked here but didn’t get answered.
How are you going to adjust bonds portion from 10 % of EDV to 30% VGIT and SCHP?
What are the steps between this transition?
VT90 VGLT10 is my current portfolio but I have no clear idea how to adjust my bond portion as I approach the retirement.
Thank you.
Probably adjust duration and allocation every 5 years or so. TIPS arrive at retirement.
I am hopefully ~25 years away from retirement. Given EDV bond duration is an average of 25 years, at what point should I consider stop buying into EDV and invest into more intermediate bond funds?
Hi John,
Big fan, I’ve been using this as my main portfolio since I found it about a year ago, with the only adjustment I’ve made being splitting the 10% EDV allocation between 5% EDV & 5% VNQ. My conviction here is wavering and I’ll likely return to 10% EDV, especially considering the current market discount on EDV.
I’m curious to hear what tradeoffs are keeping you from going long the efficient core funds in this portfolio. I understand that there’s an increase on the overall expense ratio – does that explain it? Or is it chiefly the redundancy given a preexisting allocation to EDV combined with inertia/avoiding the taxable event of a conversion?
The section showing the superiority of the efficient core funds in a back test seems to imply that it’s use of leverage somehow beats the default allocation to EDV, despite the tradeoffs. I’m sure that defaulting to this allocation is something that you’ve carefully considered (and decided against?) and I’d love to hear you expand on it further, as I’m considering switching to that allocation myself.
Thanks for all your thoughtful, public-facing work. Its very appreciated.
Nothing really. I’ve got NTSX in my taxable account. Could even be useful for tax loss harvesting to swap out as substitutes. I’m a big fan of that Wisdomtree lineup. They also have to overcome borrowing costs, which are high right now. But the average investor won’t understand those funds, so the “published” portfolio will remain without leverage.
EDV has been absolutely hammered since you wrote this article. Any thoughts in hindsight that something was missing to protect from the scenario where the US Government ramps interest rates to curb inflation, i.e. the current scenario?
No. Why would I be concerned with the past couple years of interest rate changes or fund performance when I have a 20+ year horizon? See recency bias here.
Hi John,
If you were 52 how would you adjust your allocation. I have almost all 401K, 403B rollover accounts at Vanguard. I am old so I currently have all index funds, no ETF’s and a small Roth account.
Thanks
I’m curious, why you don’t use DFA funds in this portfolio to get extra tilt?
Hi, do you have performance data for 2022? Curious to see what the drawndown was vs. SPY given the EDV exposure.
Any recommendation on splitting these funds in a traditional IRA and ROTH IRA from growth/tax point of view?
Not really since both are tax-advantaged. Could argue put bonds in Trad. IRA because we’d expect less growth than stocks.
hi, would you adjust the percentage of each fund allocation per age? when you are 40 or 60 how will you update it? thanks
Do you view this as something best suited for a tax deferred account? Or would you be comfortable doing this exact portfolio in a taxable account too? If not, what adjustments would you make for making this most suitable for a taxable account?
Tax efficiency is a continuum, not a yes or no. Obviously best in tax-advantaged space, but not horrible in taxable.
Hi John,
I just recently discovered your YouTube videos. I enjoyed watching your commentary on lazy portfolios. This led me to your website. I read your investing journey/education and it sound similar to what I have experienced. I understand your tilts towards small cap value and international. I realy like Paul Merriman’s ideas that led to his Ultimate Buy and Hold portfolio. I’m curious why you don’t include any REITS in your Ginger Ale portfolio?
Thank you again for your educational materials and no nonsense writing style.
Thanks! REITs are already inside funds like VOO, VEA, VWO, etc., tend to become highly correlated with the market during crashes, and may be replicable with bonds and small cap value stocks (see “Are REITs A Distinct Asset Class?” from Kizer).
Hi and thanks for the excellent blog! Very interesting reading, I’ve been hooked since I found it. 🙂
I’m curious about the graphs and tables above showing relative performance. Specifically, I was wondering whether they take any periodic rebalancing into account and if so, how often?
Thanks again!
Thanks, Bob. Annual rebalancing.
Hi John,
I have really enjoyed your articles and videos. Since this portfolio is heavily tilted toward small-cap value, I’m interested in your take on what it means for those factors to outperform the overall market.
As you mentioned other comments, it has been a rough 10-15 years for value. The portfolio you outline here outperforms a couple other value-oriented portfolios I’ve looked at, but it’s difficult for anything to compete with the S&P unless you start 2004ish or earlier (even ending the backtest at 2020 when the market went bananas).
Do the size, value, etc. premia just mean that portfolios with those tilts have outperformed over the long run due to their relative volatility? If we see another decade of growth domination, and we have to start backtests in 1960 for value-tilted portfolios to outperform, will we still say small/value outperform growth over the long run? Or is this too reductive, and there is other evidence of these factors besides the fact that if we go back far enough, eventually we can make small-cap value outperform the S&P?
My post on factor investing should answer all these questions.
Hi John,
I just posted a comment. Should I see it here?
Thanks.
Al
I have to approve it first.
Hi JOHN ,
I found something puzzling.
I re-checked the graphs above using Portfolio Visualizer and found that from Oct 2010 to Jun 2023 the Ginger Ale portfolio has lagged behind the S&P 500 by a substantial amount:
Portfolio Initial Balance Final Balance CAGR
Ginger Ale $10,000 $28,495 8.56%
S&P 500 $10,000 $49,185 13.31%
Ginger Ale all stocks $10,000 $30,360 9.10%
It contradicts the graphs you show in your article. Any comments?
Regards,
Al
Yes, Size and Value have both suffered during precisely that time period. Doesn’t contradict anything.
If one doesn’t have good access to EDV (I can only get it in taxable accounts), do you recommend instead going with your more leveraged portfolio of:
NTSX, NTSI, NTSE
Right now, my only bond access is Long Term Treasuries and BND.
I can’t “recommend” anything but that would be similar exposure, yes. Curious what’s the broker where you could get NTSX, NTSI, and NTSE but not EDV. ZROZ is another STRIPS fund.
I can’t get access to EDV in tax advantaged accounts, and I am guessing the value of EDV falls drastically in a taxable account. That is why I was looking at your leveraged alternatives.
Hey – I’m interested in finding the best optimization for my portfolio. I put in your recommended allocation into Portfoliovisualizer.com website and am not getting the same results as you show in the graphic above for the GAP 90/10.
VOO – 25%
AVUV – 25%
VEA – 10%
AVDV – 10%
VWO – 10%
DGS – 10%
EDV – 10%
It looks like AVUV and AVDV limit the timeframe it can show. When I replace AVUV with VBR and AVDV with FNDC to get it to start at 2014 – the portfolio return is $19k vs $28k for the S&P over that time period. This is a major underperformance.
Can you please share how you got the portfolio return graphic for GAP 90/10?
Thanks for your help!
Again, as noted, Dimensional mutual funds. “Best optimization” can only be known in hindsight.
How do you planning invest in BONDS during the time considering montly investments?
Adjust to new ETFS with lower duration in the course of the time?
Can you give examples of bonds ETFS that you pretend to invest during the time?
In THE GINGER ALE PORFOLIO you started with 10% EDV and finishes with 30%VGIT and 30%SCHP.
How will you do this transition? Can you elaborate?
Thanks for all te content here, you sure impact many people lives off all the world with this.
I’m from Brazil and learned a lot with you, Just THANKS!
Great work here. Congrats!
I’m from Brazil and my portfolio has the same distribution geographically (60%EUA, 20% developed ex-EUA and 20% emergents).
My portfolio follows the same idea about GEOGRAPHY, FACTORS and SIZES, but it has lower concentration on small caps.
Something like this:
40% VOO
20% AVUV
13% FNDF
7% AVDV
10% AVES
10% DGS (I started my portfolio with this distribution on emerging marketings, but my monthly contribution will be only on AVES to simplify the process and reduces taxes, so this distribution with DGS will decrease)
I wasn’t planning have fixed income in this long term portfolio because the rest of my money is already in fixed income in Brasil.
Nice to see this work posted here and glad to be on the way.
Your take on this setup?
COWZ Pacer US Cash Cows 100 ETF 12.00%
OMFL Invesco Russell 1000 Dynamic Mltfct ETF 20.00%
VIG Vanguard Dividend Appreciation ETF 12.00%
SCHG Schwab US Large-Cap Growth ETF 20.00%
SPGP Invesco S&P 500 GARP ETF 12.00%
SCHD Schwab US Dividend Equity ETF 12.00%
JQUA JPMorgan US Quality Factor ETF 12.00%
Is mixing indices something you care very much about or pay attention to, John? I ask because you prefer Vanguard for the total market funds and Avantis for the SCV funds, which can lead to some oddities mainly over the issue of South Korea, with it being present in your DM-LCB and EM-SCV funds but not in your DM-SCV and EM-LCB funds. I regularly see people advise to not mix your index providers when selecting funds, but in the grand scheme of things it doesn’t seem to make a big difference so long as you aren’t accidentally excluding South Korea and Poland entirely (rather than what seems like a minor overweight if you pick both a DM and EM fund that includes them).
First, thank you for the blog. Your pieces strike the perfect balance of detail, clarity, and brevity and are useful in isolation and as a springboard to deeper research.
It appears the majority of this portfolio is in tax advantaged retirement accounts. How would you modify it if the entirety were held in taxable? Stated differently perhaps, would love to see a moderate to slightly greater risk ‘lazy portfolio’ for mid-long term growth once the retirement options have been maxxed out and/or the retirement balance is sufficient.
Again, thanks for the very useful material.
What do you think of ISVL for ex-us developed value
I don’t have EDV as an available asset in my 401k, and I don’t want to waste ROTH space on a bond fund. Do you think I can accomplish similar performance from VLGSX (Vanguard Long Term Treasuray Index Fund) or should I just go with BND?
Is EDV viable in a taxable account? Thank you!